

- Bitcoin’s bull market holds steady, but overheated signals from Supply in Profit and liquidations warn of short-term corrections ahead.
- Analysts highlight Bitcoin’s resilience above $100K, yet caution that entry points may be safer after pullbacks near +0.4 SD levels.
- Despite ongoing wipeouts and volatility, liquidation data shows no cascade risk, keeping long-term bullish momentum firmly in place.
Bitcoin’s short-term conditions show signs of overheating despite the long-term bull run remaining intact. Analysts warn that a pullback could emerge soon, offering potential buying opportunities at lower levels. The warnings come amid elevated supply metrics and persistent liquidation pressures shaping near-term trading dynamics.
CryptoQuant analyst Yonsei_dent explained that Bitcoin’s Supply in Profit has declined from nearly 100% to about 91% after recent highs. The metric now rests near the +1 standard deviation band, a level historically tied to euphoric or overheated conditions.
“Current setup suggests that the long-term bull market remains intact, but short-term conditions are overheated,” he said. He added that corrections around the +0.4 SD band often create attractive buy zones.
Signals of Short-Term Pressure
The data shows Bitcoin’s Supply in Profit still trading far above its 1500-day moving average, confirming long-term bullish momentum. However, repeated moves near the +1 SD band often precede local tops and short-term corrections. Additionally, Yonsei_dent noted that bottoms tend to form closer to the +0.4 SD band, which could serve as a healthier entry point.
Besides valuation signals, liquidation data adds another layer of caution. Analyst Axel Adler Jr highlighted that net liquidations remain negative near −40 million dollars, reflecting ongoing long wipeouts. “Risk of further bearish pressure from liquidations is medium,” he said, while clarifying that no cascade risk exists for now.
Market Structure and Liquidation Trends
Data from the Bitcoin Long Short Liquidations Dashboard reinforces this mixed picture. The market has seen extreme volatility since late 2023, with liquidation spikes aligning with sharp rallies and corrections.
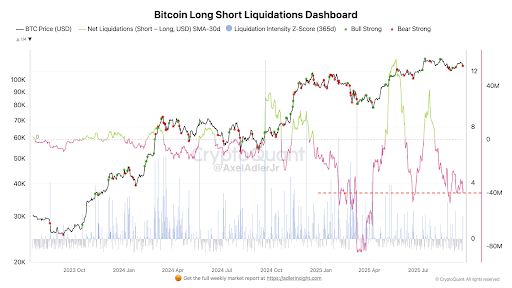
For example, the rise above $70,000 led to significant liquidations, which were followed by corrections that caused momentum to be reset. Additionally, the 30-day moving average for net liquidations highlights ongoing market turbulence by displaying alternating bull and bear phases.
Recent activity demonstrates how resilient Bitcoin is above $100,000 in spite of these persistent challenges. As a result, the market is under pressure, but not enough to cause a significant collapse brought on by liquidation.


