
- Bitcoin is struggling around $105K as repeated rejections and liquidity clusters keep short-term momentum tilted to the downside.
- Historical data shows August losses were smaller than usual, while September’s $100K support could decide the year-end rebound.
- Strong seasonal gains in March and November highlight Bitcoin’s recurring bullish cycles despite short-term volatility and heavy liquidations.
Bitcoin markets are entering September under significant pressure, with liquidity clusters forming near the $105,000 to $108,000 range. Analysts report that every small upward push retraced quickly, showing downside momentum across the chart. This situation raises concerns because sustained rejection continues to block a meaningful reversal.

Data shared on X by analyst Ted showed Bitcoin’s three-month price action between June and August. The liquidation heatmap illustrated clear leverage concentrations across major levels, marking the critical zones where traders placed heavy bets.
Liquidity Clusters Shape Market Sentiment
During this period, Bitcoin traded between $95,500 and $128,000. The chart displayed phases of high volatility alongside moments of consolidation. Yellow zones showed the highest concentration of potential liquidations around $100,000, $110,000, and $120,000. These clusters reflected significant trader activity at psychological levels.
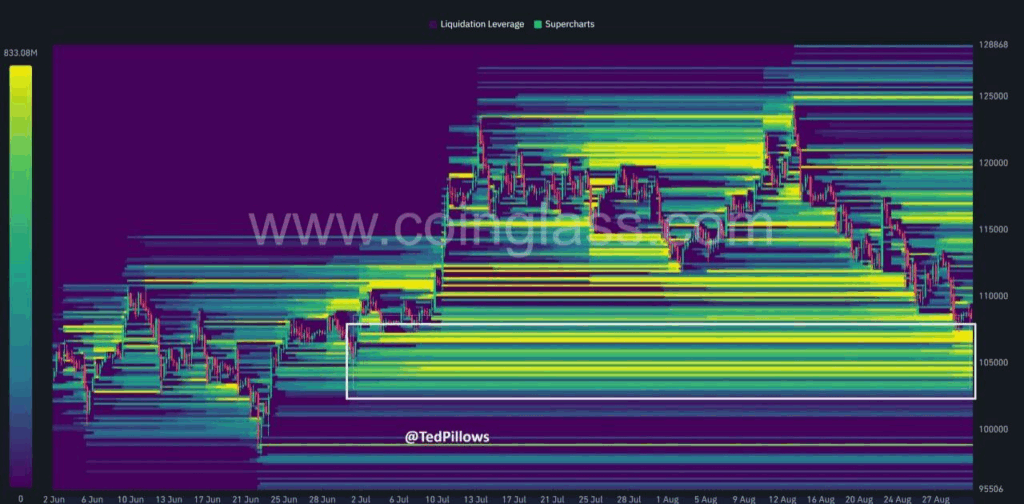
Source: Ted
Besides these dense areas, green zones revealed moderate liquidation clusters across the $105,000 to $115,000 range. This distribution indicated consistent leverage activity within the broader trading channel. Purple sections appeared above $120,000 and below $100,000, marking areas with reduced liquidation density.
Moreover, the timeline highlighted rising liquidation events in July and August. These months saw an increase in yellow bands, which correlated with regular increases in volatility. Near $125,000, Bitcoin was often rejected, but $100,000 provided consistent support throughout downturns.
Historical Returns Guide Market Expectations
Alongside liquidity patterns, Tom Tucker also analyzed Bitcoin’s monthly returns across history. His data revealed seasonal behavior influencing current sentiment. August maintained its trend, with Bitcoin sliding about 6.5%. However, this drop proved smaller compared to the past four Augusts.

Source: Tom Tucker
Additionally, historical data showed March and November as strong months for Bitcoin. March delivered a 12.21% average return, while November averaged 46.02%. Conversely, May recorded heavy volatility, including a steep 35.31% loss in 2021. December remained mixed, with returns swinging between gains and losses.
As a result, September is now considered a crucial month. Bitcoin might lead to a robust fourth-quarter recovery if it stays above $100,000. The short-term prognosis is still significantly impacted by liquidity clusters, though.