
- Bitcoin must stay above $94,600 to avoid a deeper drop toward $89,000.
- If it holds strong it could regain momentum and push past $108,906.
- Market signals show mixed strength making the next weekly close crucial.
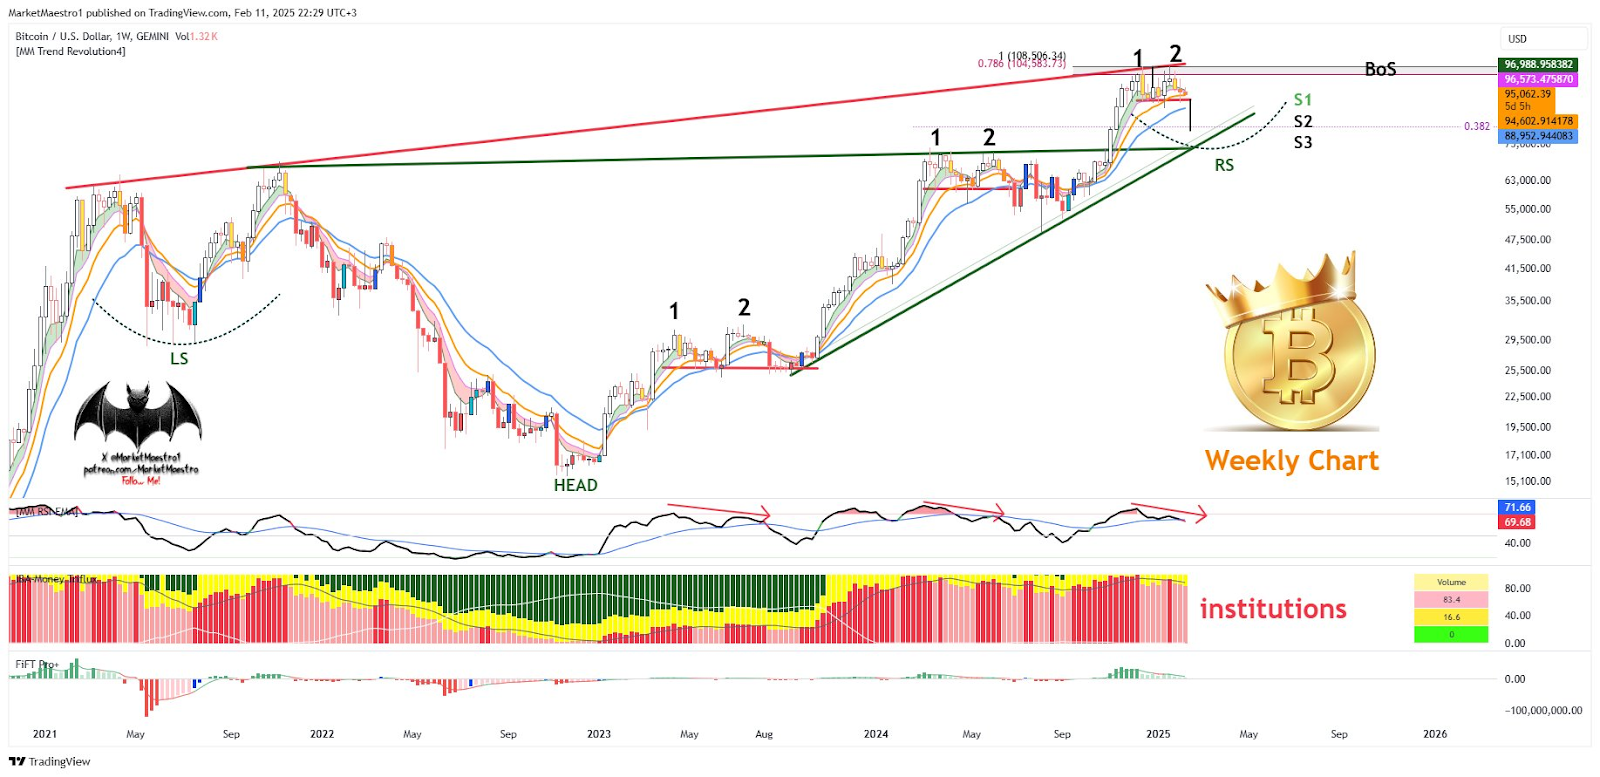
Bitcoin’s weekly chart suggests that $94,600 is the level traders should watch closely, according to MarketMaestro, a well-followed crypto analyst. The chart shows a Head and Shoulders pattern forming, with the right shoulder (RS) resting on a critical ascending trendline. If Bitcoin fails to hold this level, the analyst warns of a potential pullback to $89,000, marking a significant retracement from its recent highs. The Break of Structure (BoS) near $108,906 further suggests that Bitcoin is at a crossroads, where a loss of momentum could trigger a further downside.

Bitcoin’s Support and Resistance Levels Define the Next Move
MarketMaestro’s analysis highlights that Bitcoin trades at a critical juncture, with multiple support and resistance levels mapped out. The first support (S1) sits at $94,600, aligning with a key Fibonacci retracement level of 0.382 at $94,948, making it a crucial point for the bullish defense. A break below this level would expose S2 and S3, with S3 aligning near $71,600, the lowest retracement in the structure.
On the upside, resistance remains strong at $108,906, which marks the 0.786 Fibonacci level. Bitcoin has tested this level twice, failing to break through decisively. If BTC gains momentum and reclaims this level, it could open doors for a push towards new highs. However, the RSI indicator on the chart suggests weakening momentum, making the next few weeks critical for Bitcoin’s trajectory.
Institutional Activity and Momentum Indicators Show Divergence
A key insight from the chart is the institutional activity bar, which remains elevated but has begun to show a mix of red and yellow segments, indicating potential distribution at higher levels. This could mean that large investors are taking profits after the latest surge, aligning with the possibility of a short-term correction.
Additionally, the FIFT (momentum) indicator, which measures trend strength, has shown signs of declining bullish momentum, further reinforcing the cautious outlook. If momentum weakens further, the weekly structure may shift to a correction phase, which could see Bitcoin revisiting lower demand zones before resuming any upward trend.
Market Outlook: Will Bitcoin Bounce or Break Down?
With $94,600 as decisive support, Bitcoin must maintain this level to avoid deeper corrections. MarketMaestro’s analysis suggests that failure to hold this level could swiftly send BTC toward $89,000, which has historically acted as a reaccumulation zone.
Conversely, if BTC defends this support and builds momentum, reclaiming $108,906 could bring renewed bullish sentiment, potentially pushing the asset into price discovery beyond its previous all-time highs. The following weekly close will be crucial in determining Bitcoin’s direction, with traders closely watching whether Bitcoin breaks down or rebounds to continue its bullish trend.