
- Bitcoin faces key resistance at $91.2K; a breakdown could signal a deeper correction toward $73.7K.
- Strong support at $75,602 aligns with Bitcoin’s long-term uptrend, reinforced by moving averages.
- Consolidation phases within Bitcoin’s uptrend suggest potential pullbacks before further gains.
Aksel Kibar, CMT shows Bitcoin crucial resistance at $91.2K. A potential pullback could extend to the year-long average and the former resistance at $73.7K. A weekly close below $91.2K would confirm a breakdown, signaling a deeper correction.
Bitcoin’s Technical Structure and Market Trends
Bitcoin has shown a structured pattern of consolidations, breakouts, and retracements. A prolonged accumulation phase between $25K and $28K formed a six-month rectangle pattern. The breakout from this range triggered a sharp rally, hitting a rectangle price target of $38K.
Head and Shoulders (H&S) pattern emerged with a possible target of $34K. Once Bitcoin broke these levels, the trend became bullish. The price rose above $73.7K, a breakdown point of high importance. Bitcoin continued to rise and touched a high of $109K before going into consolidation.
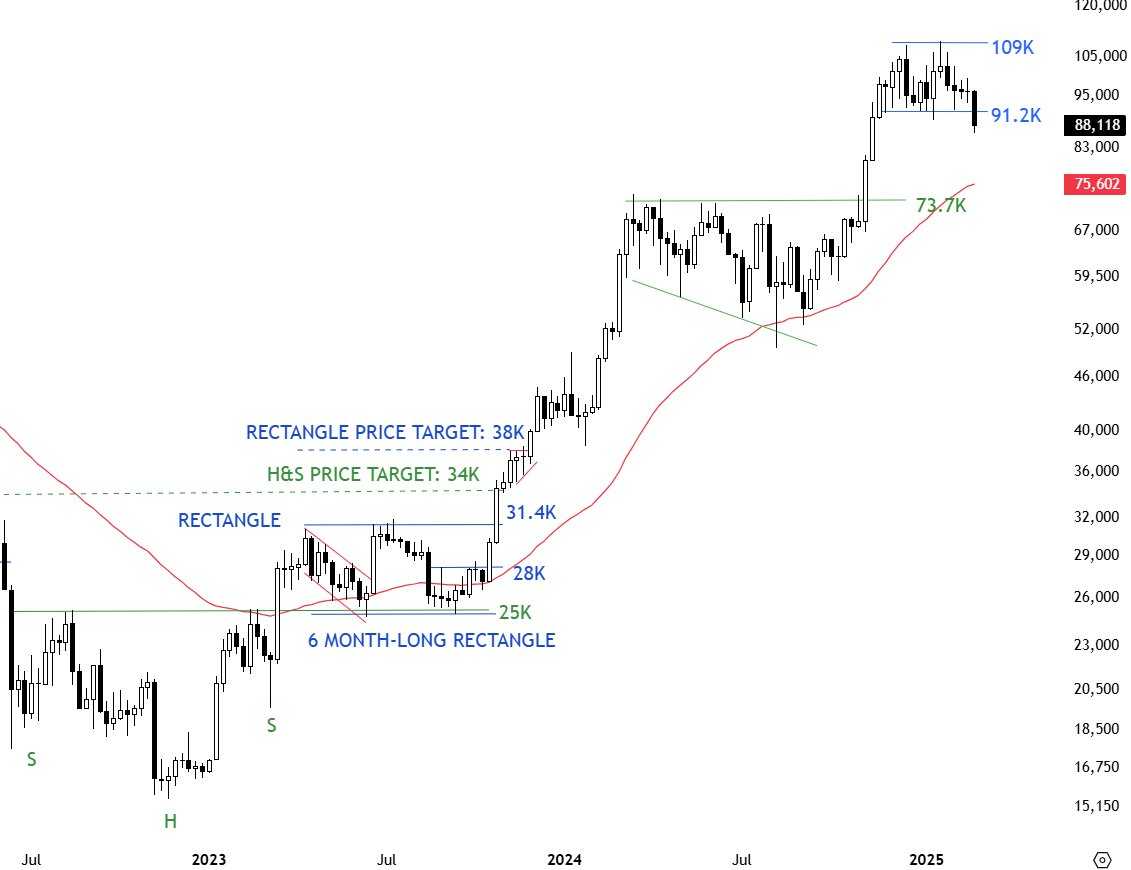
The market later retraced to $91.2K, testing previous breakout levels. With firm support at $75,602, Bitcoin is currently trading at $88,118. Long-term strength is reinforced by the upward trend of moving averages. However, as the market tests important levels, there is still a chance of short-term pullbacks.
Support and Resistance Levels Define Bitcoin’s Path
The breakout from the six-month rectangle pattern confirmed an accumulation phase. Consequently, Bitcoin’s uptrend gained strength, breaking past significant resistance zones. Previous resistance levels turned into support, forming a well-defined market structure.
The $73.7K Before becoming support, this level was a barrier. The decline may reach $73.7K if Bitcoin is unable to maintain its position above $91.2K.
Additionally, Bitcoin’s steady rise between 2023 and 2024 aligned with technical patterns. Consolidation phases within the uptrend signified temporary pauses before further gains. Moreover, moving averages support the long-term bullish trend.
However, market participants should watch for a confirmed breakdown below $91.2K. A close beneath this level on a weekly timeframe could indicate a larger correction. Consequently, traders should monitor Bitcoin’s reaction around these key levels.