
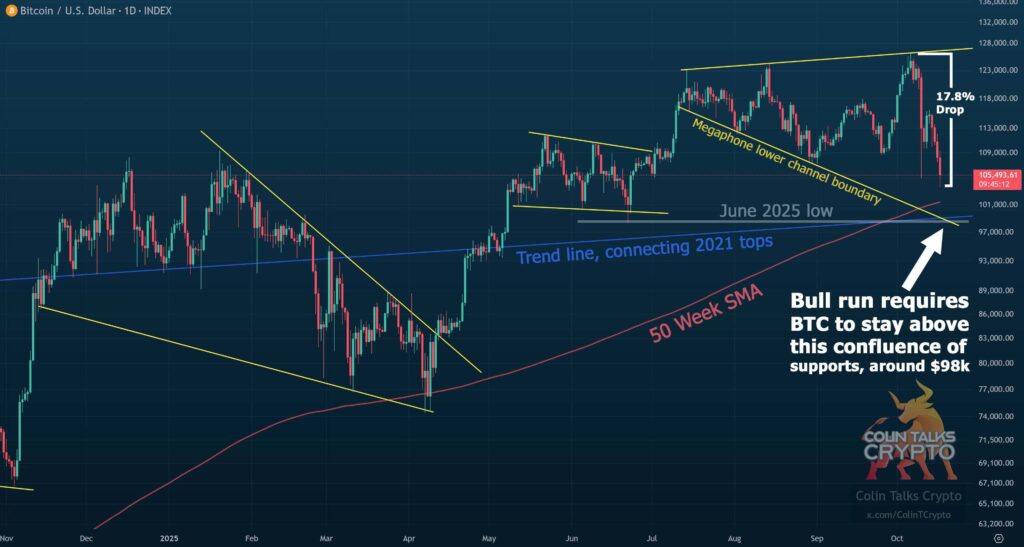
- Colin notes $98K as the confluence of the 50-week SMA, June 2025 low, and the extended 2021 trend line.
- A confirmed weekly close below $98K could lead to a move toward $90K and challenge the broader bullish structure.
- Holding above layered support at $103K–$105K may preserve upside potential toward the $115K to $120K range.
Bitcoin’s market structure has narrowed to a decisive area, with several technical reference points now aligning around $98,000. Analyst Colin stated that current price action still is inside a broader bullish cycle, yet recent movement shows momentum fading.
He noted that the market has only fallen 17.8% from the all-time high, which is within the volatility range historically seen near cycle peaks. However, he also stressed that the zone around $98,000 now separates continuation from potential reversal, making weekly closes pivotal in the coming sessions.
Converging Trend Lines and Key Price Levels
The confluence includes a long-term trend line extended from the 2021 tops, the June 2025 low, and the 50-week Simple Moving Average. These markers cluster at roughly the same level, forming a narrow floor.
According to Colin, two weekly closes below the 50-week SMA have previously confirmed cycle changes. He clarified that wicks dipping under the average would not necessarily mark a breakdown if the weekly close recovers above it. This technical nuance shows why observers are watching weekly candle behavior instead of intraday moves.
Broader Pattern Structure and Immediate Support
Above the confluence, price currently moves within a megaphone formation defined by expanding trend lines. The lower edge of that channel is near $103,000 to $105,000, acting as the first layer of support.
If that area holds, it could slow downside pressure before price tests the deeper $98,000 level. This layered structure illustrates where volatility has widened and where directional shifts may occur. Notably, the analyst pointed out that the market would need to reclaim broken support zones even if new highs eventually form.
Potential Scenarios Around the Support Zone
A close beneath $98,000 would open a path toward $90,000 to $92,000, based on prior structural lows in that range. That outcome would also challenge the broader bullish framework that has held through most of the year.
However, maintaining the confluence provides a base for a rebound toward $115,000 to $120,000 in the mid-term. Colin added that the current decline has not yet matched prior cycle drops, which have sometimes reached 20% to 30%. For now, attention centers on how price interacts with the SMA, the 2021 trend line and the June 2025 reference point.