
- Bitcoin holds strong above $92K support, signaling bullish momentum; a drop below could test $85K.
- Resistance at $106K remains firm—breaking it could push Bitcoin into new price discovery highs.
- A falling wedge breakout suggests rising buying pressure, aligning with historical bullish patterns.
Bitcoin hovers above levels of support that may signal potential upward momentum. The cryptocurrency consolidates within a defined range where it has its support at $92,122 and resistance near $106,329. Buyers defending this zone may help Bitcoin find itself in price discovery mode.
Current Market Structure and Key Levels
Pentoshi, a popular crypto analyst, highlights Bitcoin’s primary support between $92,000 and $94,000. Holding this zone suggests bullish strength. However, losing this support could push BTC down to $85,000. At the moment, the bullish bias remains intact, as Bitcoin has spent time within its current range without breaking down.
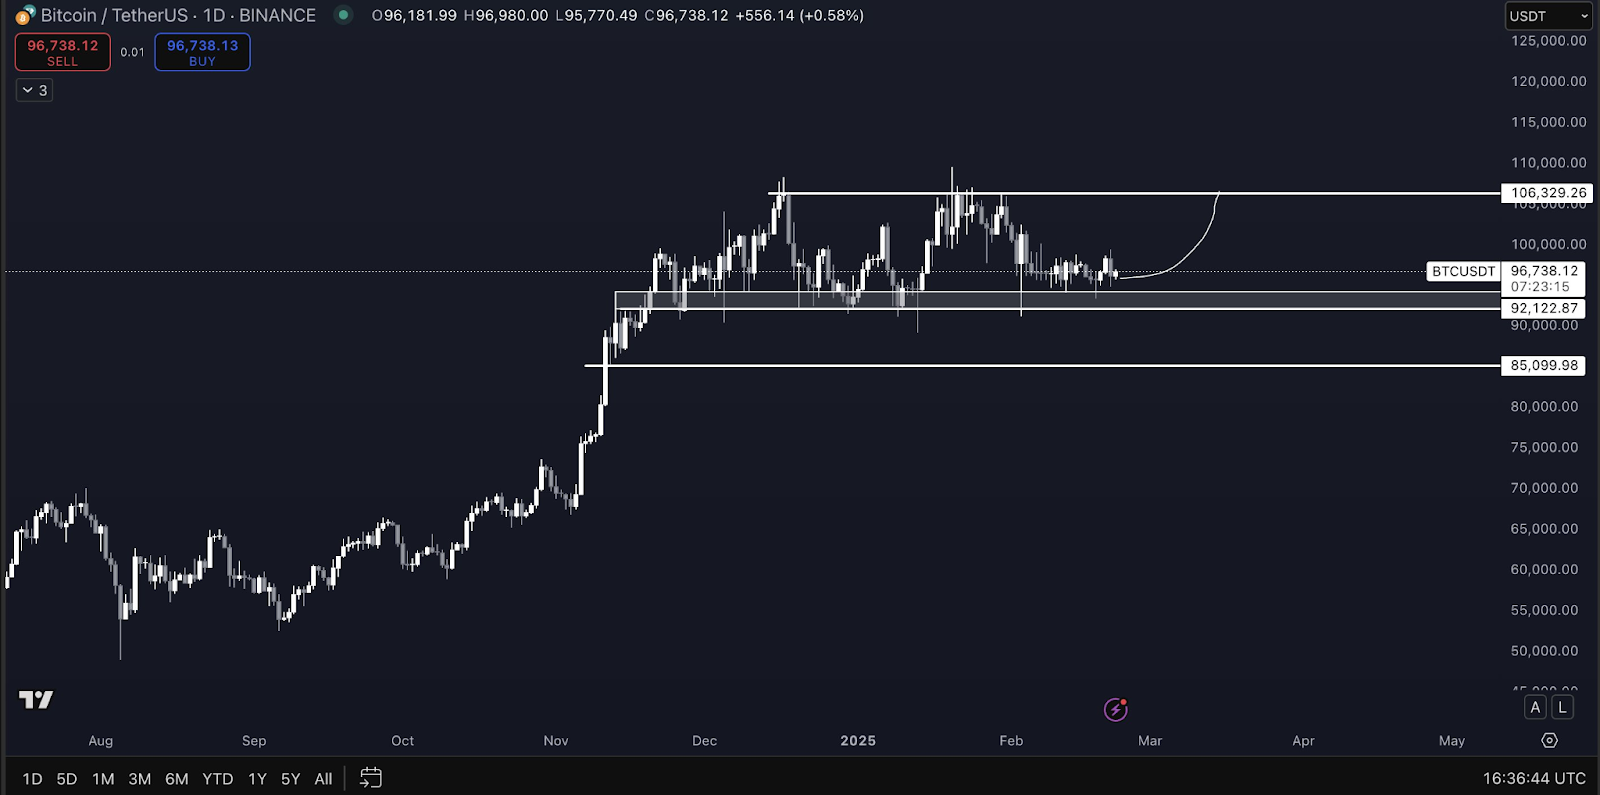
At present, Bitcoin appears to be at $96,738, representing a small gain of 0.58%. The higher price for the day was $96,980, and the lower price was $95,770. Price features suggest a possible consolidation phase that might precede a major breakout.
Resistance at $106,329 has been tested multiple times but remains unbroken. A successful breach could ignite another rally, driving Bitcoin into new highs. Market structure remains bullish, with buyers stepping in at key levels to maintain higher lows.
Falling Wedge Pattern Suggests Bullish Breakout
Crypto analyst el_crypto_prof discovers a falling wedge pattern on the Bitcoin 12-hour data. This technical formation is typically bullish, whereby the price action consolidates and finally breaks out between two downward-sloping trendlines.
Bitcoin’s price movement within the wedge showed multiple lower highs and lower lows. Red arrows on the chart highlight resistance zones, while blue arrows indicate strong support. Near the wedge’s apex, Bitcoin broke above descending resistance, signaling a possible trend reversal.
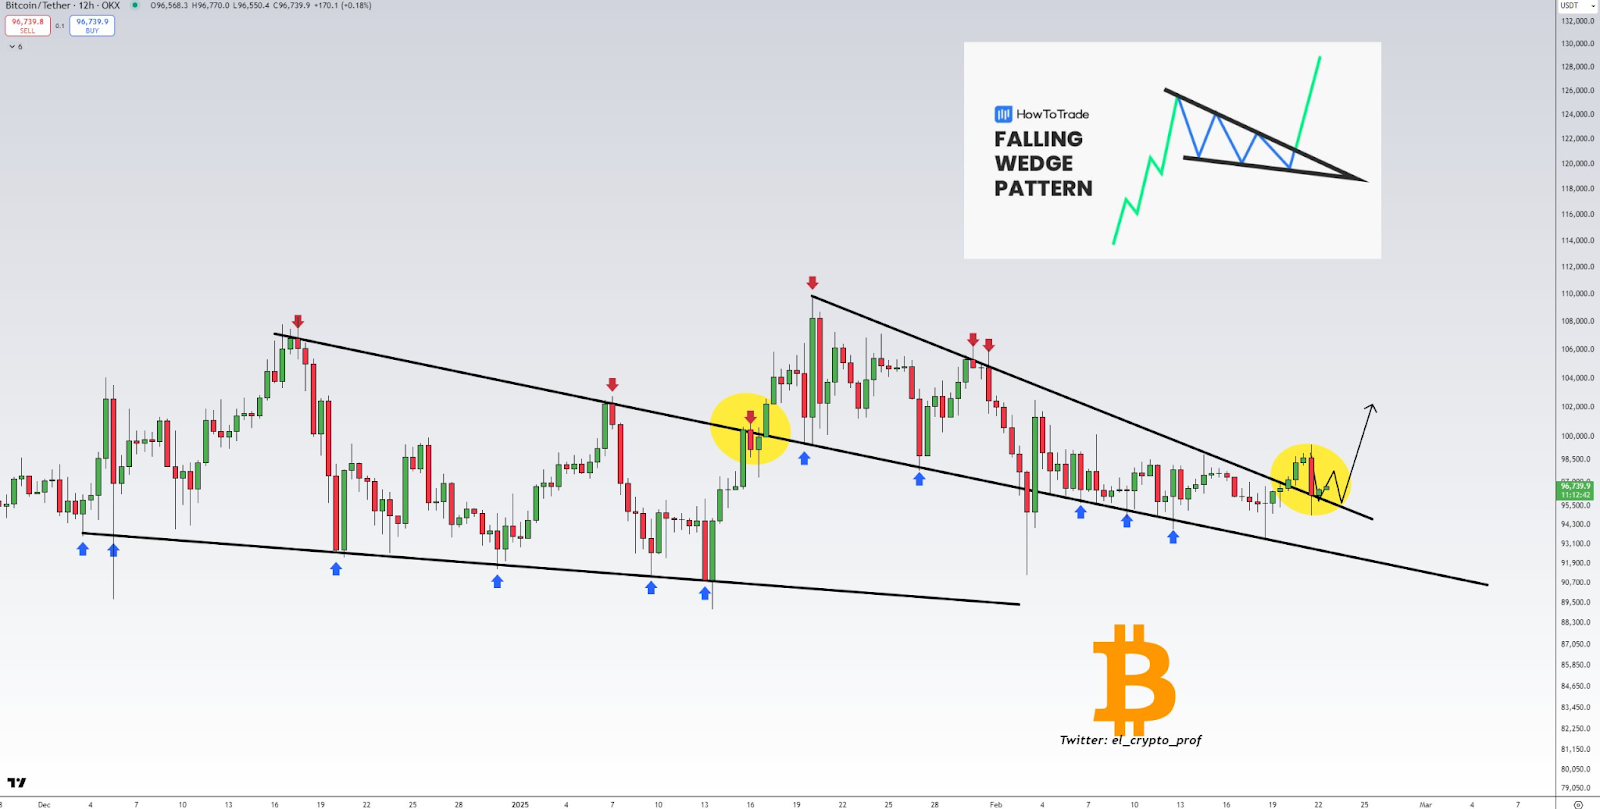
Key breakout and rejection points are marked with yellow circles. The first circle shows temporary resistance before another downward move, while the second highlights Bitcoin’s breakout above the wedge. This formation suggests increasing buying pressure, which may fuel a sustained upward movement. The wedge structure aligns with Bitcoin’s historical breakout patterns. Additionally, the market has shown accumulation within this range, further reinforcing the bullish outlook.