

- Bitcoin is near $102,800 and must break above it to reach $110,000 or higher with strong bullish momentum still in play.
- If BTC fails to hold $97,000, it could drop toward $83,000 or even $71,000, where major support levels are found.
- Fibonacci levels show Bitcoin could hit $105,854, but traders are watching if it can sustain the rally or face another rejection.
The price of Bitcoin exhibits action at a critical point, with $102,800 being perceived as an influential resistance zone for determining the next major trend. With the price hovering at $97,670 level, Bitcoin consolidates within a bullish structure, with higher lows supporting continued upside momentum.
Fibonacci extensions point to the possibility of a move towards the 2.618 extension level at $105,854, creating an area for a significant breakthrough for Bitcoin. Conversely, if $102,800 fails to flip and hold as a support, we could see a retest of lower demand zones around $83,000 and $71,000.
Wave Analysis Signals Strong Bullish Momentum
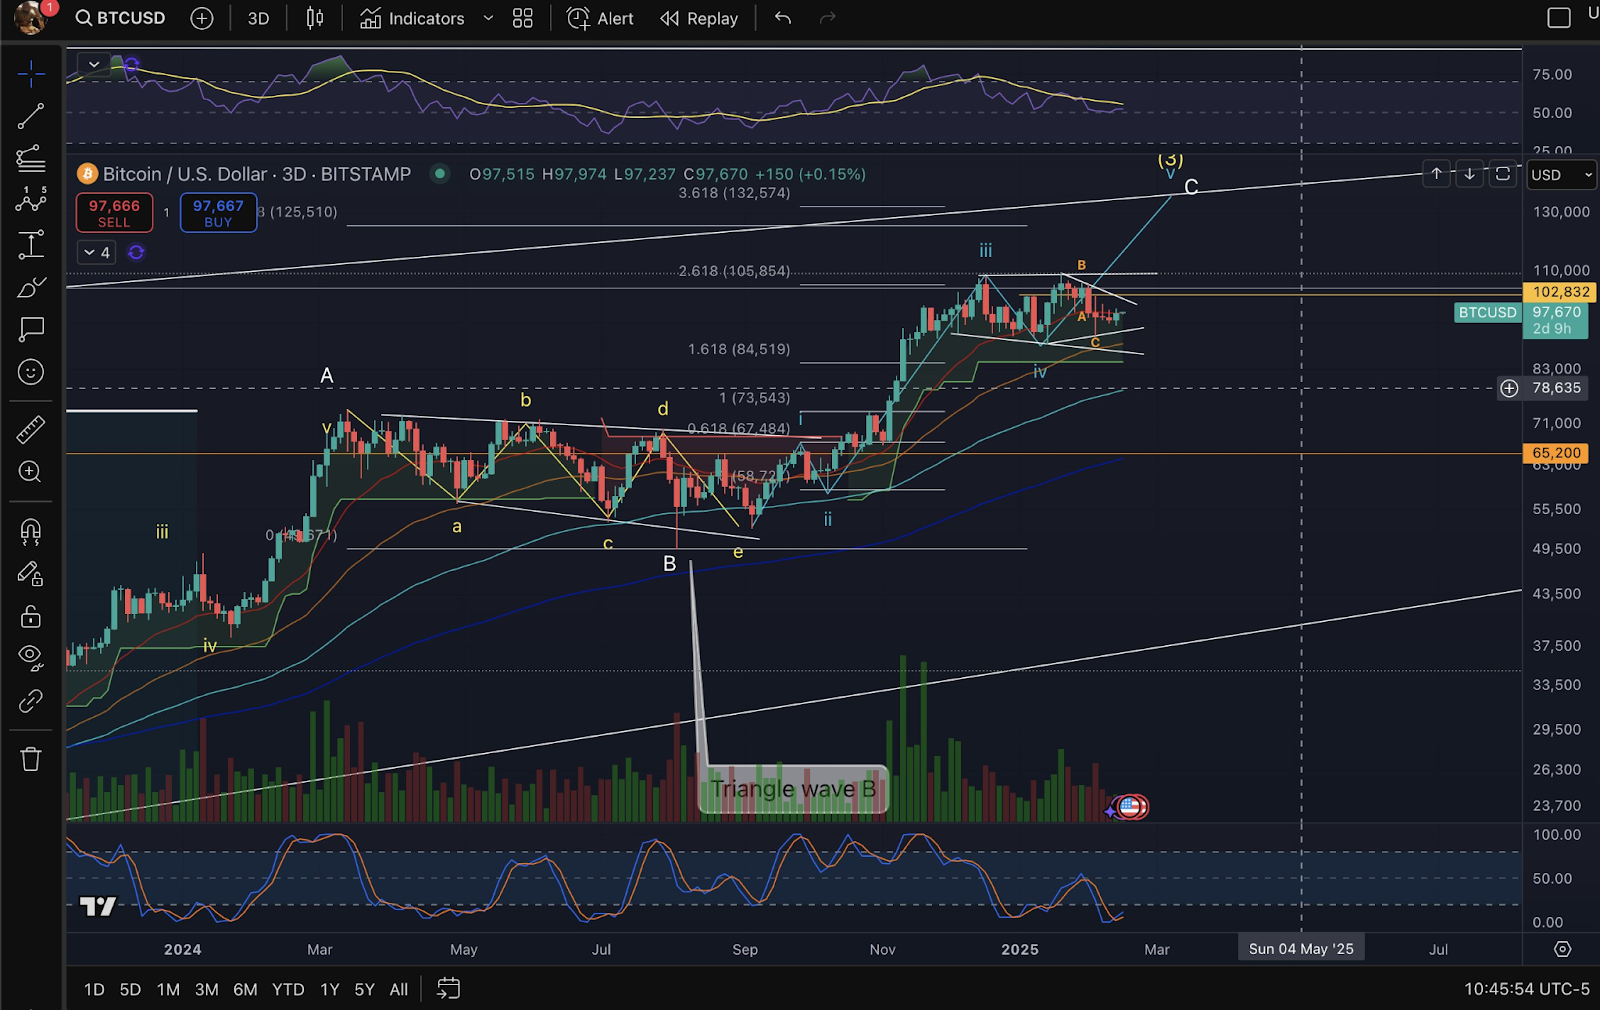
Bitcoin’s Elliott Wave structure suggests it is currently within wave (3) of a larger impulsive move. The formation of wave iii is evident, with prices bouncing from previous Fibonacci retracements at $67,484 (0.618 level) and $77,535 (1.618 level). The triangle formation labeled as wave B played a crucial role in consolidating price action before the bullish breakout.
The price structure has remained intact above the 200-day moving average, further reinforcing bullish sentiment. Additionally, the stochastic RSI shows a slight overbought condition, but historical patterns suggest that Bitcoin can extend further before a significant pullback.
Key Support Levels and Risk Considerations
The level of $83,000 for Bitcoin seems to have strong support due to a previous liquidity zone, while the level of $71,000, which coincides with a long-term trendline, fortifies GBPUSD at the 0.618 Fibonacci retracement. A drop below $71,000 could see the currency pair tumble toward the $65,200 area, which has already acted as a magnet for liquidity in the past.
Traders are focusing closely on $102800 with an upside breakout. If it breaks, then $110k and possibly $132,574, the 3.618 Fibonacci extension, will be in sight for Bitcoin**. But if it drops back below support at $97k, this would likely skew sentiment toward a temporary turn downwards.
Market Sentiment and ETF Outflows Impact
At present, short-native price changes are affected by Bitcoin ETF flow. Cautious traders view such outflows as triggers for freak movements. Such a change of mixed sentiment in the social backdrop is about optimism and concern, as users once again argue about whether Bitcoin would be able to sustain the rally for him or at $102,800, a rejection could possibly lead to a deeper retracement.