

- Bitcoin has dropped 30% in 2024 but past cycles saw even bigger dips before rising to new highs.
- The 2017 and 2020 cycles had 50% corrections yet Bitcoin still reached all-time highs.
- Panic selling has never worked as Bitcoin always follows deep drops with strong recoveries.
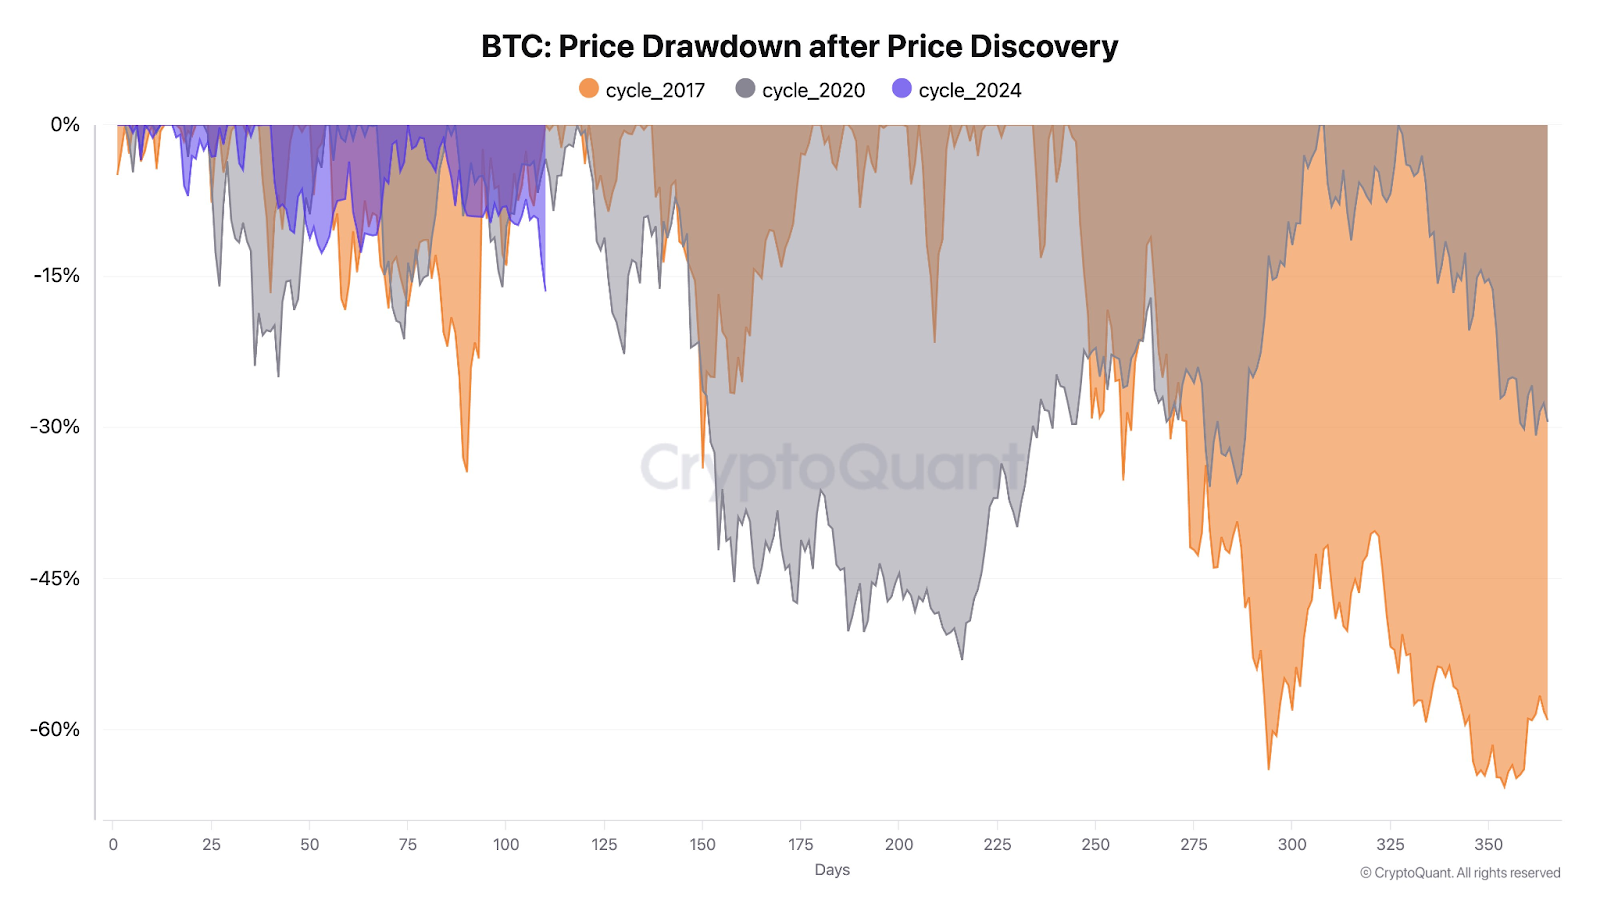
Bitcoin’s latest correction has triggered panic selling, but historical data suggests this is part of a typical cycle. A chart comparing BTC price drawdowns in the 2017, 2020, and 2024 cycles highlights a pattern of deep corrections followed by strong recoveries. The 2024 cycle, shown in purple, mirrors past cycles, with a drawdown of around 30% after price discovery. In comparison, Bitcoin saw a 53% decline in 2021 before recovering to an all-time high.
Historical Corrections Point to Market Resilience
The 2017 cycle, marked in orange, experienced sharp declines exceeding 60% before rebounding to new highs. The 2020 cycle, highlighted in gray, followed a similar pattern, with multiple 30% to 50% corrections before reaching its peak. The current 2024 drawdown is playing out in the same way, suggesting that market volatility is a recurring event rather than a sign of structural weakness.
Bitcoin’s price movements have historically followed a predictable cycle: sharp corrections, consolidation, and eventual price discovery. The data shows that selling during these phases has consistently proven to be a poor strategy, while those who held through volatility benefited from long-term gains.
Current Drawdown Matches Past Recovery Patterns
Despite Bitcoin’s 2024 dip, the trend aligns with prior cycles, where temporary corrections paved the way for higher valuations. Market participants who react impulsively to dips often lose out when the price eventually stabilizes and resumes its upward trajectory. The data suggests that Bitcoin’s long-term cycle remains intact, with deeper drawdowns leading to new price discoveries over time.
Panic Selling Goes Against Market Data
The accompanying post warns that panic selling during a bull cycle is a mistake, reinforcing the importance of a strategic investment approach. Historical data confirms that 30% pullbacks are common, and Bitcoin has previously endured worse declines before reaching new highs. The current correction follows a well-documented trend, making short-term fear an unreliable guide for long-term decision-making.
As Bitcoin continues its 2024 cycle, the price chart suggests that volatility remains part of the process. Those who ignore past data may find themselves exiting too soon, while seasoned investors recognize that every major rally in Bitcoin’s history has included significant, yet temporary, declines.