
- Bitcoin loses key Golden Line support but maintains its bullish structure by holding above $100K for 44 consecutive days.
- Technical patterns like BOS, CHOCH, and a double bottom near $102,988.77 confirm strong bullish structure despite recent dip.
- Bearish divergences and MACD shifts spark caution, yet Bitcoin’s consistent higher lows indicate long-term strength remains intact.
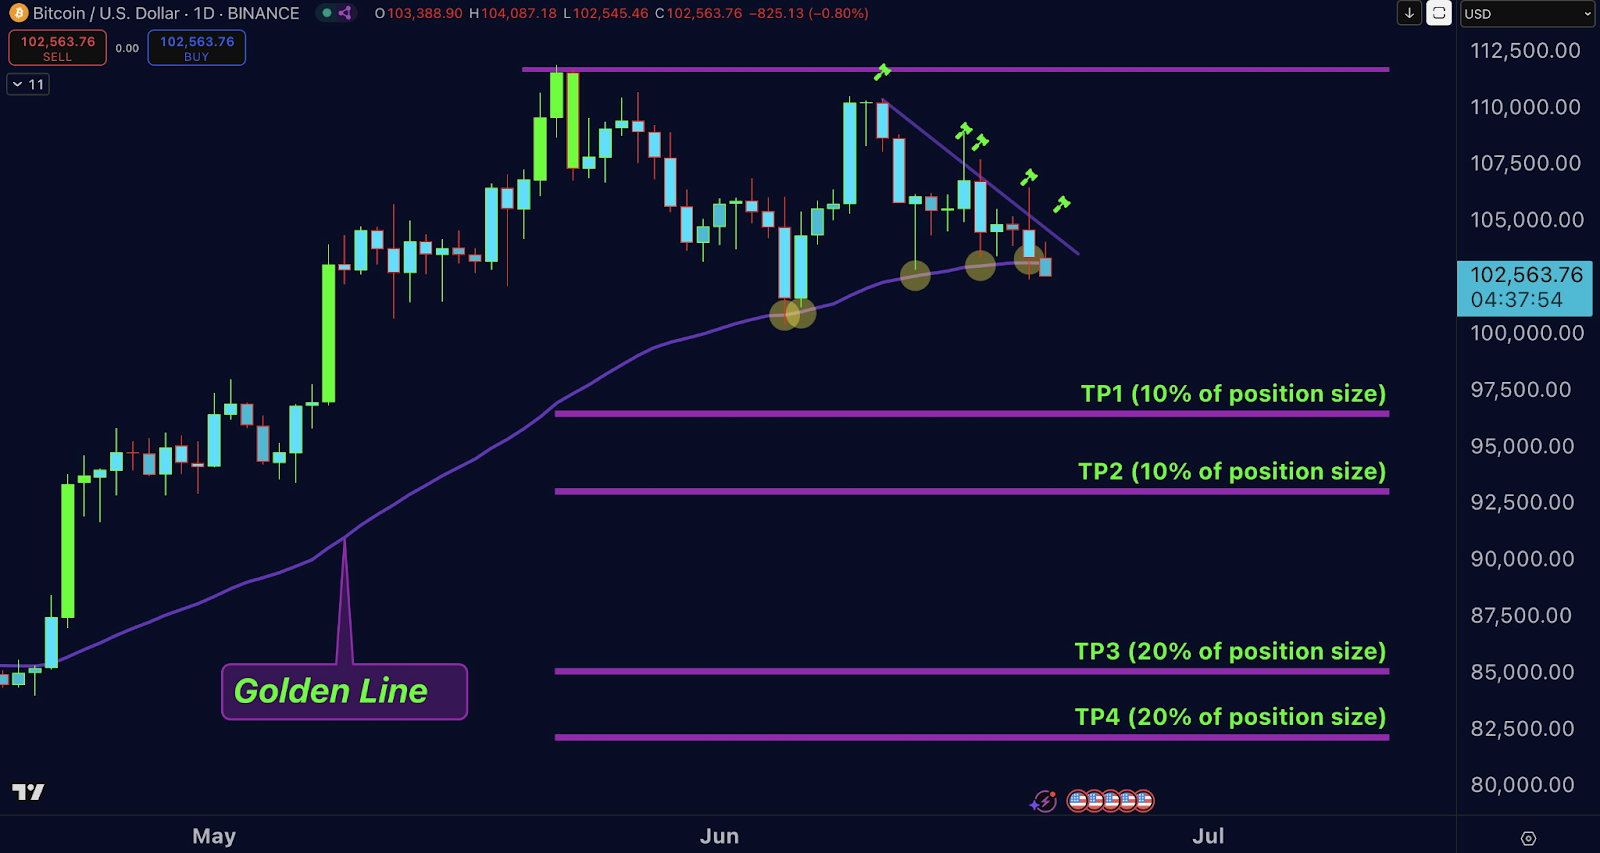
Bitcoin recently lost a technical support level dubbed the “Golden Line,” intensifying bearish sentiment. At present, Bitcoin trades at $102,563.76, a decline of 0.80% from previous levels. The move follows an extended rally from May’s low near $87,000. Despite this dip, Bitcoin has held above $100,000 for 44 days, maintaining its long-term bullish trend.
Source: Doctor Profit
Doctor Profit, a prominent crypto analyst, outlined multiple reasons for his bearish stance. These include bearish divergences across all major timeframes and a downward shift in the MACD on higher timeframes. Additionally, the Fear and Greed Index has not reached extreme fear levels, suggesting more downside potential. Doctor Profit believes the current setup mirrors the 2021 cycle, further supporting his short position.
Golden Line Breached as Consolidation Expands
The chart from Binance highlights a consistent uptrend from late May to mid-June. During this time, Bitcoin surged above $104,000 before pulling back. The “Golden Line” served as dynamic support during this ascent. However, the recent price action broke below this line, reflecting weakening short-term momentum.
Take-profit levels remain scattered across the chart. TP1 and TP2 account for 10% each of position sizes. TP3 and TP4 allocate 20% each to lower targets. These levels help traders manage risk amid volatility.
Furthermore, volume levels surged during the initial rally but have since normalized. Bitcoin experienced mild consolidation phases throughout the rally. Green and red candlesticks appear frequently, pointing to mixed sentiment.
Uptrend Structure Intact as Support Holds
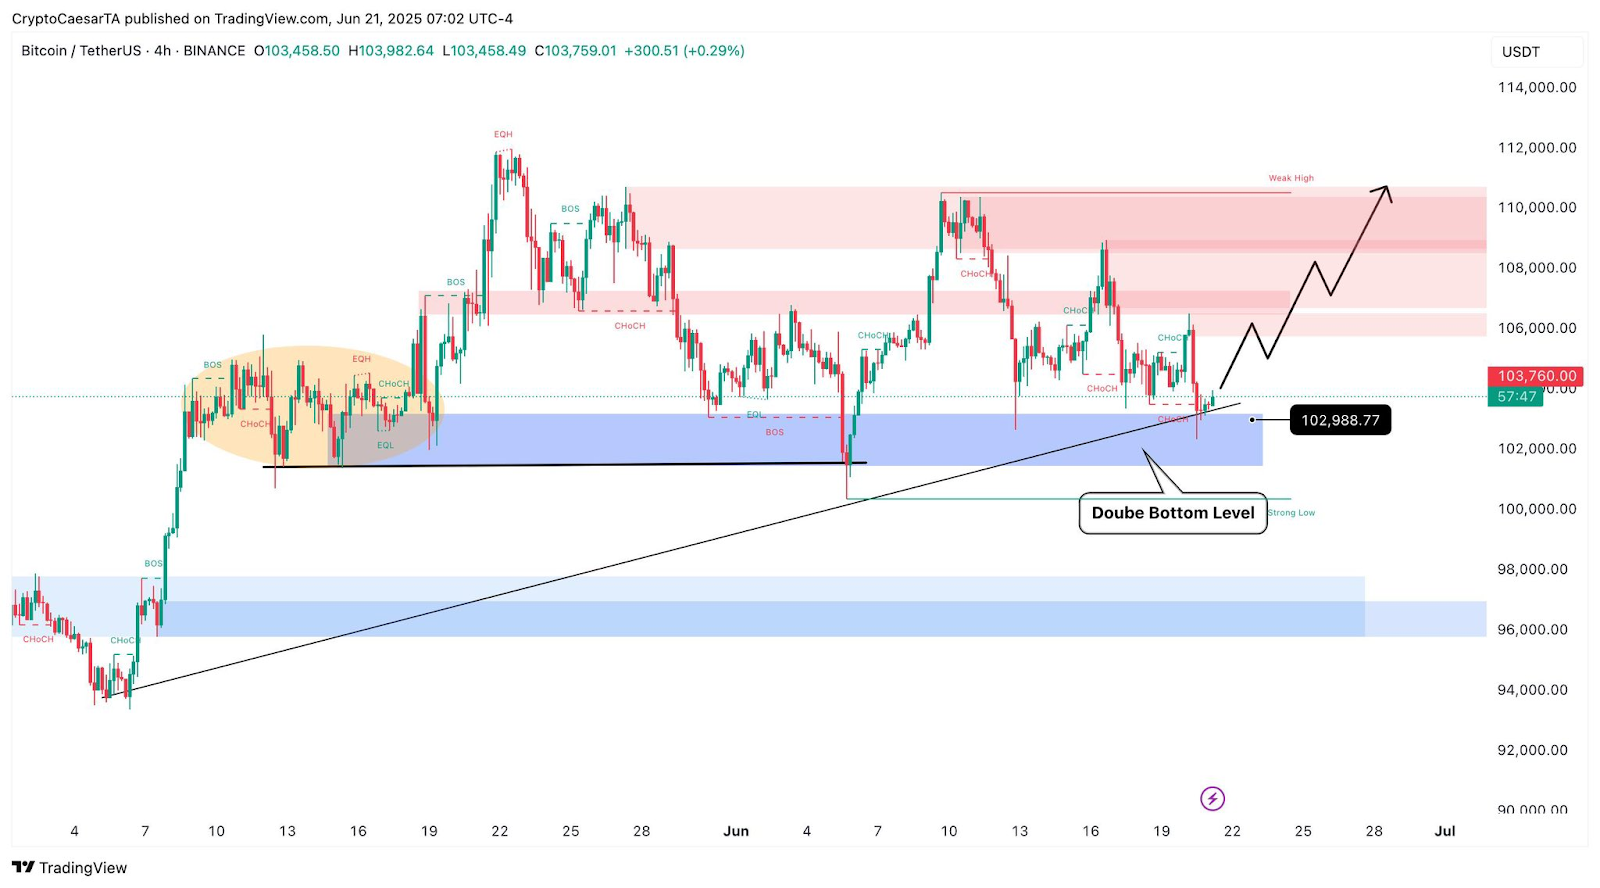
On TradingView’s 4-hour chart as per analyst Crypto Caesar, Bitcoin trades at $103,759.01, showing a modest 0.29% increase. Price surged from $94,000 in early June, establishing higher lows consistently. A double bottom formed near $102,988.77, signaling a bullish reversal from support.
Source: Crypto Caesar
Besides, the ascending trendline remains intact, supporting a bullish market outlook. Break of Structure (BOS) and Change of Character (CHOCH) points confirm momentum shifts. Colored zones indicate consolidation, resistance, and strong support areas.
Moreover, price recently broke above $103,000, sustaining strength above key levels. Technical patterns and momentum indicators suggest continued resilience. Hence, Bitcoin still shows promise, despite near-term bearish pressures.