
- Bitcoin’s price hovers near $95,582, facing risks of decline if it drops below key support levels around $95,000.
- A breakout above $98,000 could drive Bitcoin toward $100,000, with long-term bullish trends still intact.
- Bitcoin’s momentum shows signs of reversal, potentially leading to upward movement if key resistance levels break.
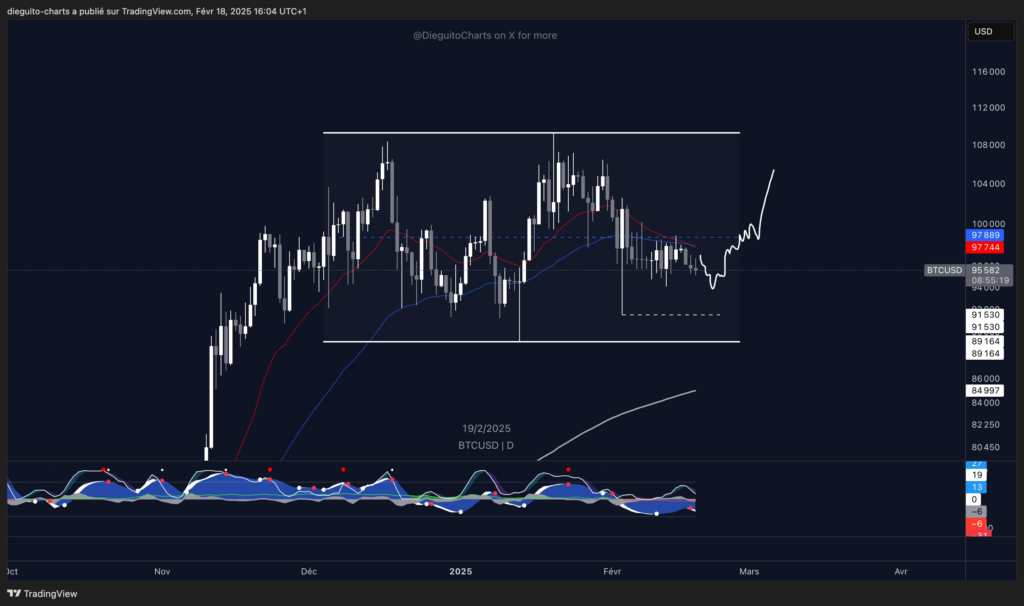
According to analyst Dieguito Charts, Btcoin has the capacity to fill the $94,000 wick and is now trading below its mid-range. However, Bitcoin might experience a further slide toward the bottom boundary of the range or perhaps return to the $86,000 support if it is unable to hold above the $95,000.
The daily chart of Bitcoin displays a distinct range of $86,000 to $108,000, with the price most recently challenging the lower end of this range. The price showed a slight recovery, touching close to $91,530. Resistance is still hovering just below $98,000, a crucial level that, if broken, may open up even more upside. Horizontal price indicators, such as $89,164 and $84,997, provide important levels of support. It is still possible for Bitcoin to move toward the lower end of the range if it is unable to maintain current support regions.
Momentum Oscillator Signals Reversal Potential
The chart also shows the changing momentum, evidenced by the oscillating momentum indicator. The indicator recently crossed out of the oversold region, indicating a possible bullish reversal. Additionally, the creation of a rounded bottom pattern at the lower support may be the beginning of a rise. If the price surmounts the $98,000 resistance level, Bitcoin could target a rally above $100,000.
Moving averages further reflect market indecisiveness. The short-term red moving average tracks fluctuations near current price levels, while the blue moving average indicates a broader, long-term bullish trend. This suggests that, despite recent volatility, the market structure remains intact.
The long-term trend line is still bullish in spite of the short-term consolidation. This suggests that Bitcoin is still in an uptrend as long as it stays above important support zones. A strong breakout over the resistance level of $98,000 would be the beginning of a new upward run that aims to reach even higher price levels. However, as Dieguito Charts indicates, a deeper retracement could result from any failure to maintain above important levels.