
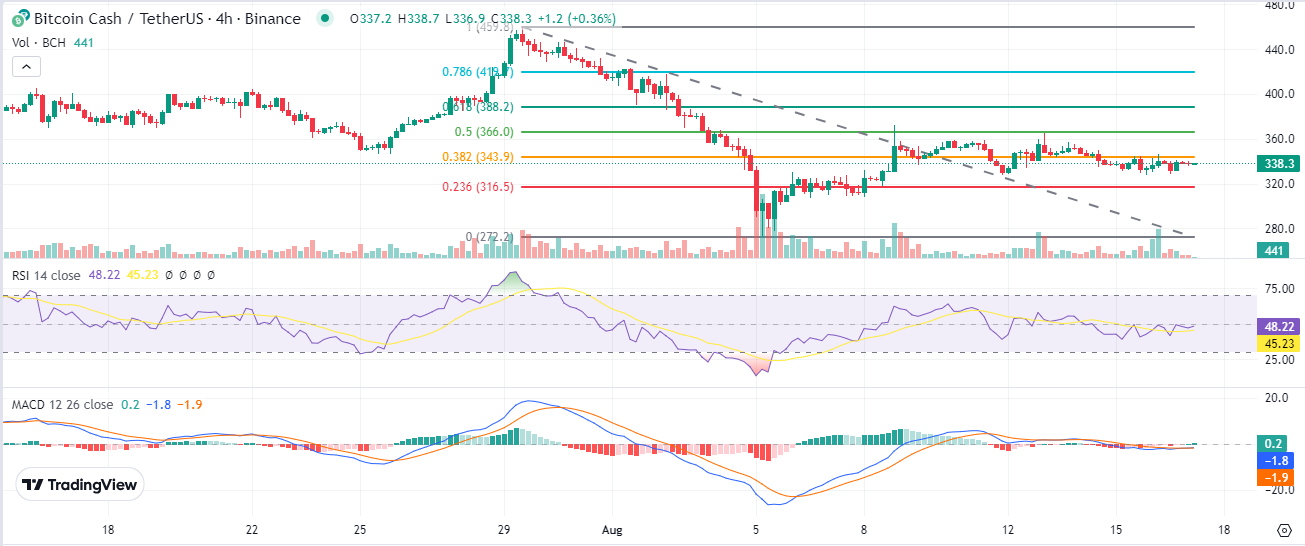
- BCH consolidates near $338.3, holding above the 0.382 Fibonacci retracement, signaling potential bullish breakout.
- RSI remains neutral at 48.22, suggesting market indecision as buyers and sellers battle for control.
- Recent low trading volumes and weak MACD momentum signal cautious optimism as BCH eyes a possible move to $3,745.89.
Bitcoin Cash (BCH) has been experiencing notable movements in recent trading sessions. The cryptocurrency, which has historically seen a downward price trend, is now showing signs of possible upward momentum. Analyst @JavonTM1 suggests that Bitcoin Cash is at a pivotal point, with indications that it may be gearing up for a price shift.

Potential Breakout to Target Price
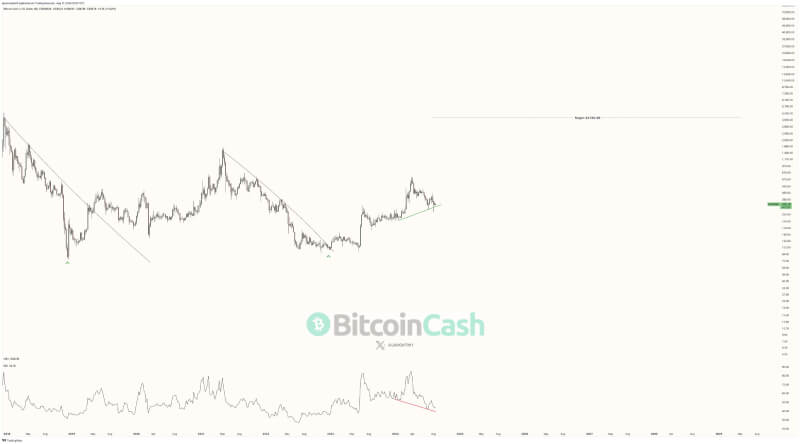
Bitcoin Cash has been trading in a consolidation phase, with its price showing some stability near the $338.3 mark. Notably, the price has been holding above the 0.382 Fibonacci retracement level, calculated from a previous high of $418 to a low of $272.2. The potential for an upward breakout remains, with a target price of $3,745.89 identified in recent projections. This target suggests a potential gain if the upward trend holds.
Source: JavonTM1 on X
The price action has broken away from its downward trend, and while it is now consolidating, the key focus remains on whether it will maintain this support level. Should it do so, the possibility of a larger move towards the projected breakout target cannot be dismissed.
Indicators Signal Market Indecision
Several technical indicators suggest indecision in the current market. The Relative Strength Index (RSI) sits at 48.22, which remains neutral and does not signal any extreme overbought or oversold conditions.
This neutral position highlights the ongoing tug-of-war between buyers and sellers, with neither side gaining control. However, the RSI’s slight upward trend may indicate that buyers are beginning to regain some influence.
 Source: CryptoRank
Another key indicator, the Moving Average Convergence Divergence (MACD), shows minimal divergence between the blue signal line and the orange MACD line, which further suggests weak bullish momentum. The histogram remains close to neutral, underscoring the market’s indecision.
Volume and Momentum Watch
Recent trading volume has remained relatively low, with the volume having hit its support level twice and stabilizing at approximately 441 units. This stability reflects limited trading activity, which could change in the coming days depending on how the price interacts with key Fibonacci levels.
The slight positive momentum observed in the MACD histogram supports this neutral outlook, though it remains weak. Analysts are closely monitoring these indicators to gauge whether a stronger bullish momentum will develop.