
- Bitcoin Bottoming Zone metrics show valuation levels historically linked to long-term accumulation periods.
- ETF outflows and positive funding rates continue limiting stronger bottom confirmation signals.
- Galaxy Research data suggests only four of thirteen major bottom indicators have triggered.
Bitcoin Bottoming Zone indicators are attracting attention as several long-term metrics approach historically attractive levels, while key confirmation signals remain absent amid weak ETF demand and restrictive macro conditions.
Valuation Metrics Point Toward Accumulation
Market analyst Tanaka stated on X that Bitcoin has entered a deep value area. Several key on-chain indicators are near historical lows, he said. Bitcoin was trading about 51% lower at the time of the comments.
The post mentions that the MVRV right now is around 1.15. Meanwhile, the MVRV Z score has been near the level of 0.36. NUPL is also hovering near the hope and fear boundary.
The post added that SOPR remains close to the neutral level. Fear and Greed readings recently recovered from extremely depressed levels. However, sentiment remains far from euphoric conditions.
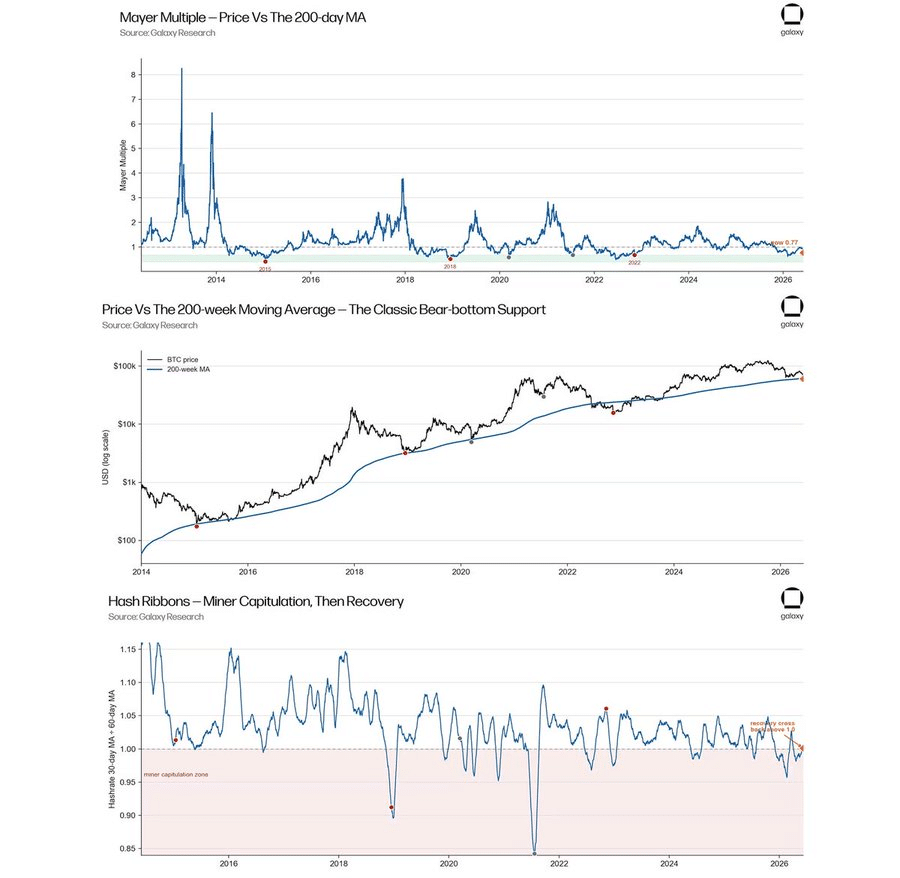
Galaxy Research’s Mayer Multiple chart supports that cautious assessment. The indicator recently traded around 0.77. Historically, readings below one often appear during undervalued market phases.
Historic Bottom Signals Remain Incomplete
Galaxy Research’s 200-week moving average chart shows another important trend. Bitcoin remains above the long-term support level. Previous cycle bottoms often included a brief move below that benchmark.
Tanaka noted that the classic flush beneath the 200-week average has not occurred. Because of that, some traders remain hesitant. Many view such events as final capitulation signals.
The Hash Ribbons chart presents a similar message. Miner stress appears to be easing gradually. Yet the data does not reflect extreme capitulation conditions.

Tanaka pointed to the Puell Multiple near 0.75. Earlier bear market bottoms often formed below 0.4. As a result, miner-related indicators remain short of historical extremes.
ETF Flows and Macro Conditions Stay Critical
The post identified funding rates and ETF flows as primary indicators. He said persistent negative funding paired with positive ETF demand would be constructive. That combination could indicate stronger spot absorption.
Current ETF activity presents a less favorable picture. June recorded approximately $2.3 billion in net outflows. The month also produced a record thirteen-day outflow streak.
Macro conditions continue influencing market expectations. The Fed has recently kept its rates in the range of 3.50%-3.75%. Updated projections showed a higher expected policy rate for 2026.
Inflation forecasts also moved higher, while real yields continued rising. According to Tanaka, those conditions have historically challenged Bitcoin recoveries. Galaxy Research data currently shows only four of thirteen major bottom indicators activated.
Tanaka’s base scenario anticipates extended consolidation through the summer months. He expects long-term holders to continue absorbing supply. A final retest or lower low later in 2026 remains possible before broader confirmation emerges.