
- Bitcoin tests critical MA200 support at $83K; a break below may trigger increased selling pressure.
- Persistent bearish momentum as Bitcoin forms lower highs and lows, struggling to surpass resistance levels.
- Liquidation heatmap shows intense activity around $84K-$85K, indicating high market pressure and volatility.
Bitcoin’s price is showing volatility as it approaches the crucial MA200 daily moving average according to Doctor Profit. Currently trading at $83,042.31, the digital asset is experiencing downward momentum. A break below could trigger further selling pressure.
Bitcoin Testing Key Support Zone
Bitcoin’s price action on the 6-hour timeframe reflects a consistent downtrend. The chart displays lower highs and lower lows, confirming the bearish momentum. The MA200 daily moving average, represented as a white trendline, is acting as a critical support level. The price recently tested this level, causing a temporary halt in its downward movement. Historically, Bitcoin has bounced from this support, highlighting its importance in market structure.
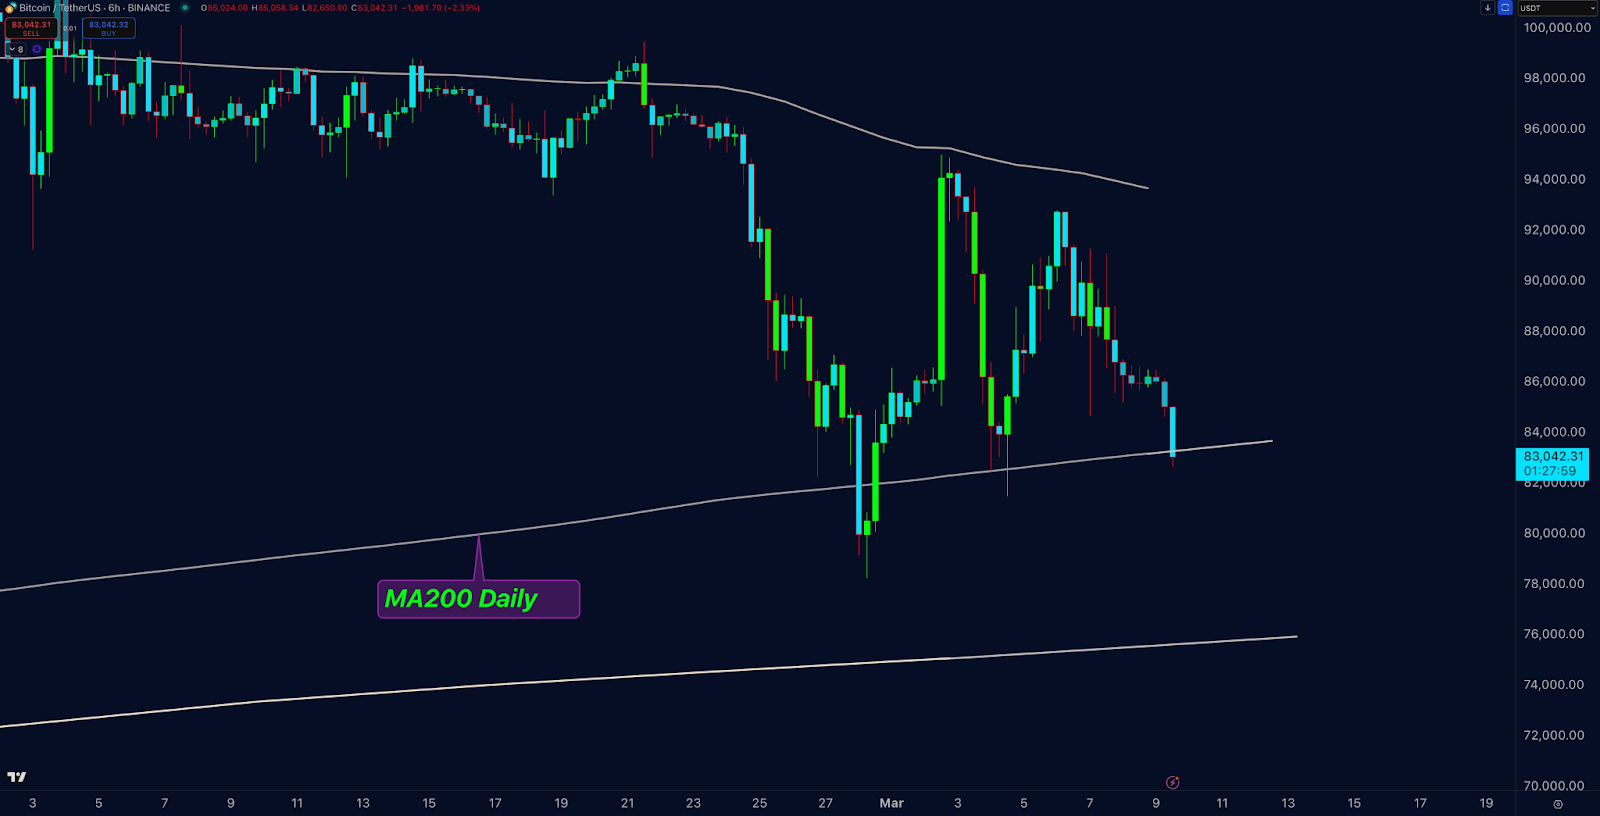
Resistance at the upper trendline remains strong. Buyers have repeatedly failed to push the price higher, leading to sharp rejections. This price behavior confirms the presence of strong selling pressure near resistance levels. Additionally, Increased volatility is indicated by candlestick wicks, where price fluctuations are swiftly moving both up and down.
Bearish momentum has been strengthened by Bitcoin’s recent steep slide from above $90,000 to its present level. If the price fails to hold above the MA200, further downside risks may emerge. However, if Bitcoin stabilizes and gains upside liquidity, a short-term recovery could be possible.
Liquidation Heatmap Highlights Market Pressure
Analyst Stockmoney Shows the Binance BTC/USDT liquidation heatmap insight into leveraged position activity. Over a 24-hour period, liquidation activity has been observed around key price levels. The heatmap reveals intense liquidation between the $84,000 and $85,000 range. Yellow and green bands suggest substantial trader exits and stop-loss triggers.
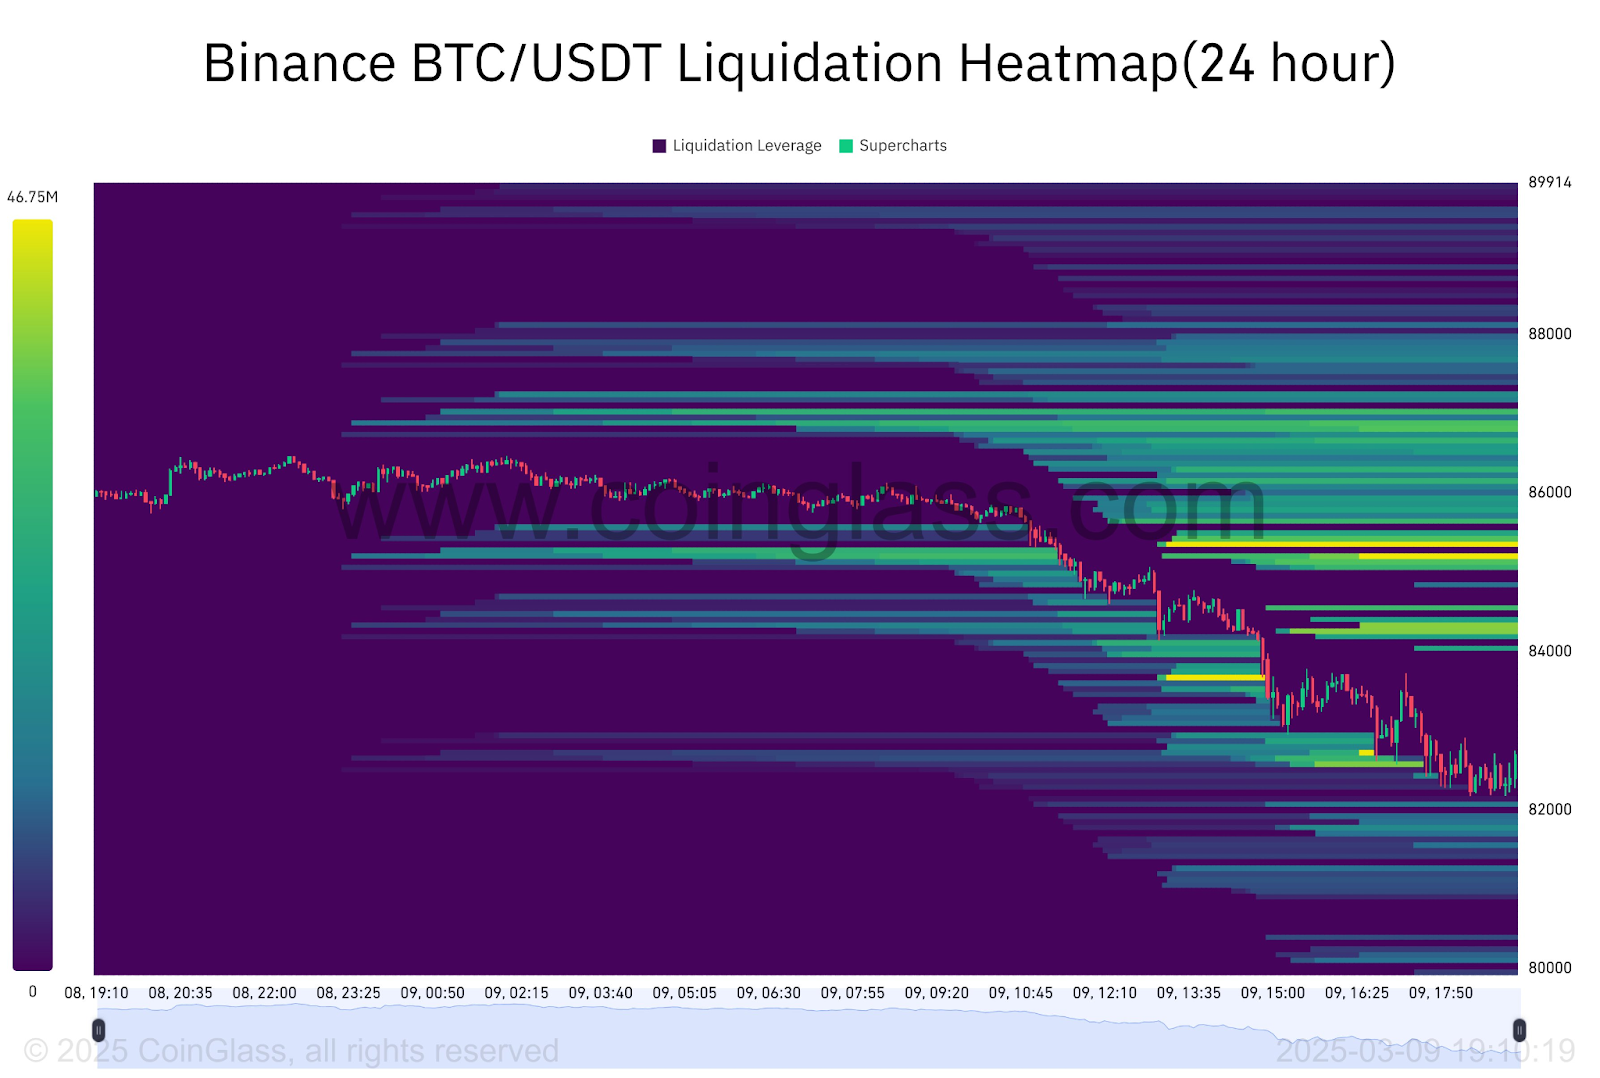
As Bitcoin fell below $83,000, liquidation activity surged. Green and yellow bands intensified, confirming high levels of forced closures. The price later stabilized around $82,000, though liquidation persisted at smaller volumes. This suggests continued market uncertainty, with traders closely watching key support and resistance levels.