
- $ASTRA tests key support at $0.8754-$1.15219 after a 14.17% drop, with potential for recovery or further downside.
- RSI at 43.70 signals neutral-to-oversold conditions; historical data suggests past rebounds from current support levels.
- A breakout above $1.78 could push $ASTRA toward $2.89 resistance, but failure to hold support may lead to deeper losses.
Crypto Caesar, a well-known technical analyst, has identified $ASTRA as an intriguing buy opportunity. The asset, issued by AstraLabs Inc., has recently unveiled SuperNova, a product inspired by Bolt.
This innovation allows users to transform concepts into fully functional websites or applications within seconds. While this development adds fundamental value, the technical outlook suggests that $ASTRA is navigating a crucial price zone after a sharp decline.
Key Support Zone Tested as Price Declines
$ASTRA has dropped by 14.17%, reaching $1.14397, according to DEXTools.io. A critical support zone between $0.8754 and $1.15219 has been tested by the price. Further losses could result from a breakdown below this zone, but a rebound might suggest fresh bullish interest.
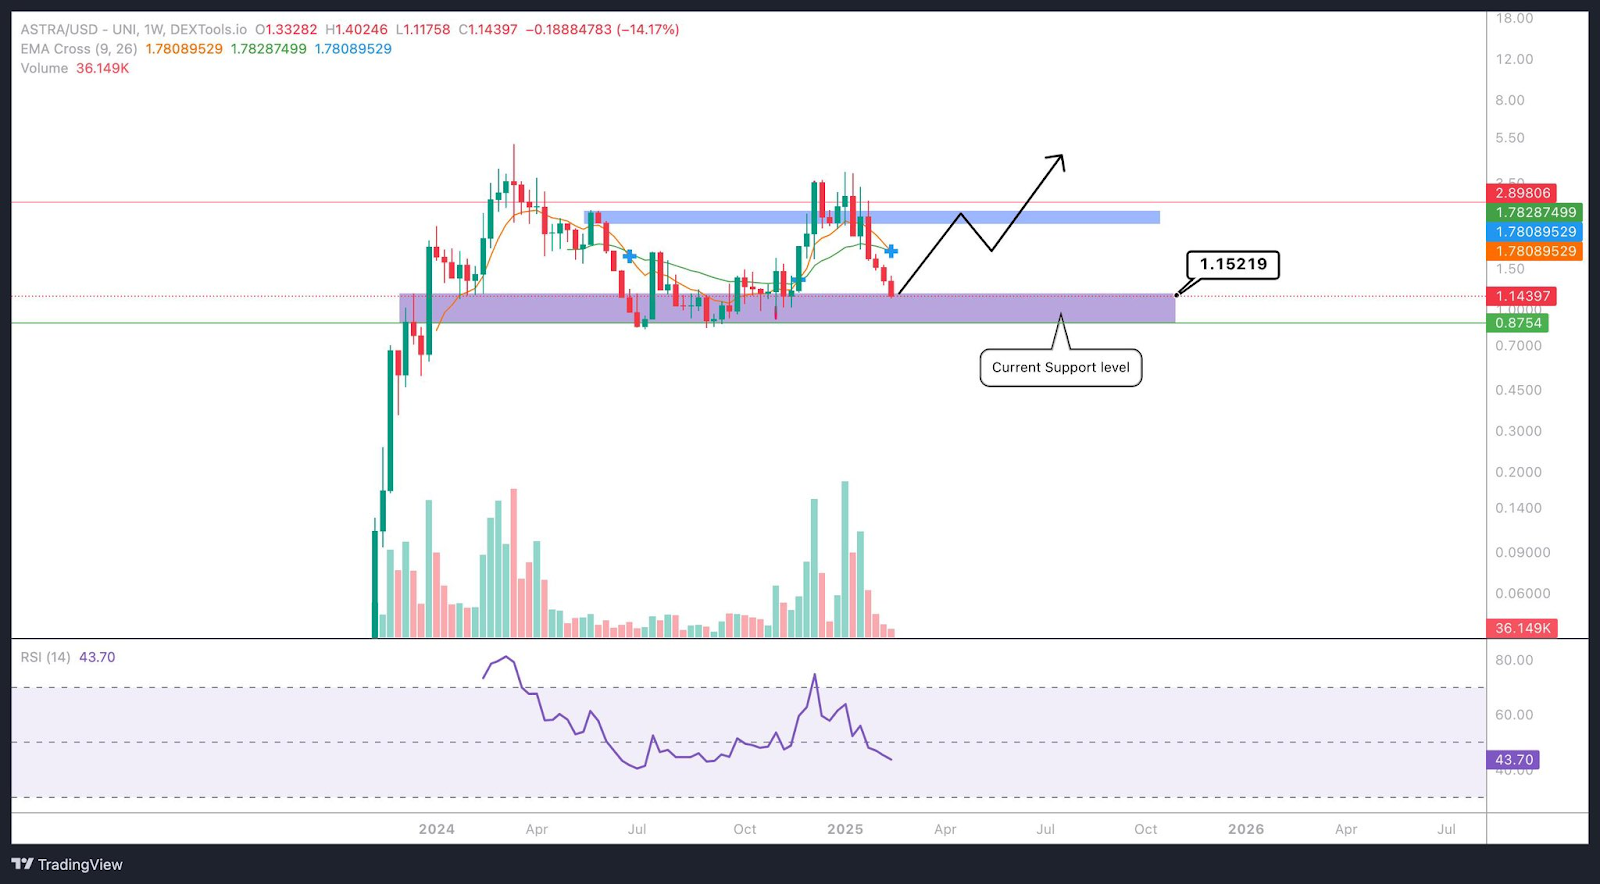
The asset has been dropping for quite a while now, as depicted on the weekly chart, falling below the 9-day and 26-day exponential moving averages (EMA), which currently stand at $1.7808. All this manifests an immediate negative outlook.
The Relative Strength Index (RSI) reads 43.70, suggesting neutral conditions but leaning toward oversold territory. If selling pressure intensifies, the price could test the lower support boundary at $0.8754. However, historical data indicates that this support level has triggered strong recoveries in the past.

Potential Reversal and Resistance Levels
A bounce from the current range could lead to a reversal toward $1.78, aligning with the EMA resistance. If momentum builds and the price surpasses this level, $ASTRA could retest the major resistance at $2.89. This level has historically acted as a strong barrier, with multiple rejections observed.
Market volume stands at 36.149K, indicating active participation. Increased buying pressure at current levels could signal a trend reversal. However, if the support zone fails, a deeper correction may follow.