
- Aster stays within its broader trend as price holds major structural levels, even after the correction pushed it beneath the 1.16 resistance zone.
- Momentum remains weak across MACD and RSI as market compression continues, leaving traders focused on a breakout above the 1.13–1.16 range.
- A potential move toward the 1.24 region depends on buyers reclaiming overhead resistance and breaking the descending trendline that caps short-term recovery.
Aster Market Update shows a market attempting to stabilize after slipping beneath a key support zone. Current conditions reflect a fragile trend as buyers work to regain short-term control while broader structure remains intact.
Local Resistance Pressures Short-Term Recovery
Analyst ArdiNSC noted that Aster moved directly through the 1.16 support and tapped liquidity near 1.10. The market then attempted a rebound, but price action continued to compress beneath the 1.13–1.16 overhead band.
This zone has been the main barrier for any short-term momentum shift.The pair formed a descending triangle, and each lower high continued to press into the same resistance area.
This structure shows that buyers must reclaim the zone to restore trend strength on lower timeframes. Price responses here have remained muted, keeping the trend fragile.
Traders now watch for a two-level breakout. The market needs to flip the overhead region into support and then break the descending trendline.
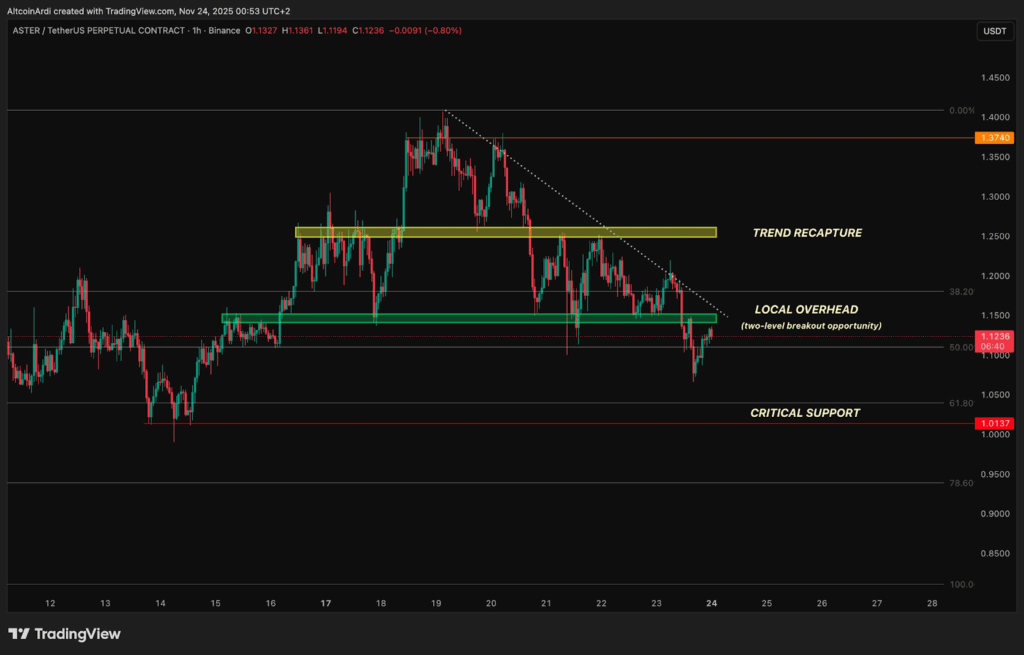
Doing so would open movement toward the 1.24 trend-recapture zone, a level that historically triggered stronger bullish reactions.
Trend Structure Holds Despite a Steady Drawdown
Aster’s broader trend remains intact despite the correction.The market has preserved its structural rhythm, even as bearish pressure continues.
The sudden negative sentiment from traders gravestomping the asset, yet the major trend still shows support layers holding. The 1.00–1.03 pocket remains the critical zone for maintaining broader stability.
If price fails to reclaim resistance overhead, further consolidation inside the lower range is likely. Market behavior within this range has been orderly, and traders continue to monitor whether buyers defend the 1.00 region during the next volatility cycle.
Momentum Indicators Reflect Compression and Weak Activity
Momentum readings reinforce the idea of a market waiting for a directional break. MACD action sits flat near zero, with both lines intertwined and showing weak momentum.
Small negative bars signal mild bearish drift without strong selling activity.RSI readings near 41 show subdued movement. Buyers have not produced strong peaks, and sellers have not driven conditions toward oversold territory.
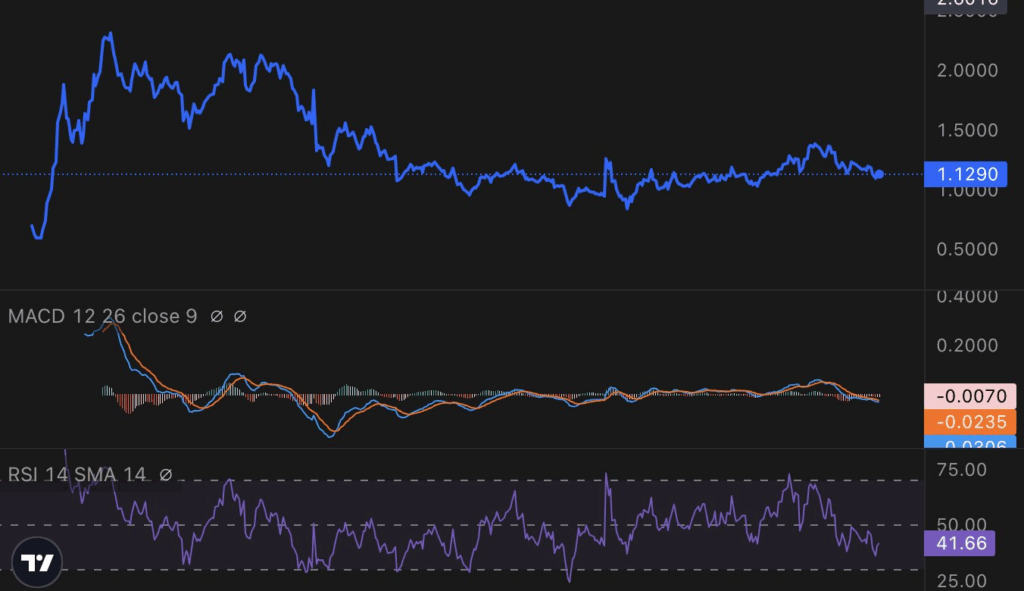
This places the asset in a neutral but pressured state as traders wait for a decisive move.Price action also reflects rounded decline followed by narrowing movement near 1.1290.
This pattern shows exhaustion on both sides. The lack of volatility keeps attention on the key breakout zone above, where buyers must regain control to shift momentum.