- ARB posts large net inflows and renewed market interest as liquidity concentrates on Layer-2 ecosystems.
- ARB price shows recovery after recent lows, supported by rising volume and stronger participation.
- Liquidation trends point to reduced leverage and calmer conditions after October volatility.
ARB shows renewed strength as liquidity inflows, improving market activity, and calmer leverage conditions shape a shifting outlook. The data reflects notable movement across net flows, price action, and liquidation levels over recent months.
Net Flows Reflect Expanding Market Activity
ARB begins this cycle with large liquidity inflows that reshape the competitive landscape. Marc Shawn Brown shared that the network recorded $25.8B in net inflows during the past three months. This change places ARB ahead of other ecosystems, with traction building around developer growth and user participation.
These inflows separate ARB from chains showing mixed or negative movement. The strong position contrasts networks such as Ethereum Mainnet, Polygon PoS, and Avalanche C-Chain, which faced persistent outflows. The movement indicates broader market rotation toward scalable environments where high-activity applications continue to grow.
Other networks like Starknet, Solana, edgeX, and Ink also saw mild positive flows. Their results support user preference for alternative execution layers. Still, ARB maintains the largest expansion, placing it at the center of recent capital migration.
Price Structure Shows Recovery and Elevated Activity
ARB as of writing, trades at $0.2170 as the market responds to recent pressure and renewed momentum. The asset posts a weekly gain and sees increased trading activity, with market cap rising more than 12% and daily volume up more than 37%. These changes reflect stronger engagement rather than short-term volatility.
Price action shows a steady pattern before December, followed by a downturn toward $0.19. The decline aligned with broader market softness. ARB then moved upward with a clearer recovery, climbing back into the $0.21 zone where it currently stabilizes.
Volume growth supports the structure of this rebound. The rising participation indicates deeper liquidity returning to the market. With a circulating supply of 5.61B ARB and an FDV of $2.16B, activity continues to expand in parallel with renewed ecosystem traction.
Liquidation Trends Show Reduced Leverage Exposure
The liquidation chart displays modest activity through the summer months. Small long and short liquidations show a balanced market where traders maintained guarded exposure. Price movements during this period remained steady with minor directional shifts.
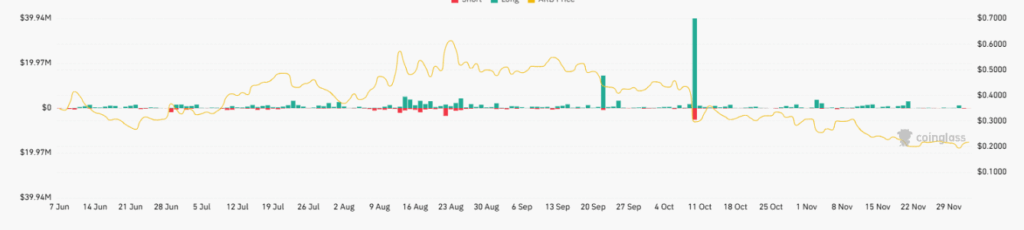
A major event appeared in early October, with a large long liquidation spike followed by a notable short liquidation. This rare pattern reflected high volatility and rapid market repositioning. The movement aligned with a sharp price adjustment near the $0.40–$0.50 range.
Since then, liquidation levels have eased. November showed smaller liquidations as traders reduced leverage and repositioned around lower price levels. The calmer environment suggests a market preparing for new catalysts with reduced risk exposure.