
- IncomeSharks says a dip below $100K could cause panic but would still keep Bitcoin’s bullish structure intact.
- The $100K level acts as dual support, aligning with Bitcoin’s long-term ascending trendline since mid-2024.
- Analyst Killa expects BTC could reach $110K–$111K ahead of CPI data if the government shutdown causes no delays.
Bitcoin’s price movement around the $100,000 level has drawn attention from market analysts who see it as a defining technical area for the asset’s next move. The crypto retraced from its $120,000 peak, entering a correction phase that many view as part of a broader, still-intact uptrend. Analysts note that the $100,000 mark is both a psychological barrier and a confluence of strong technical supports that have historically led to rebounds.
Bitcoin’s Bullish Structure
According to analyst IncomeSharks, a brief dip below $100,000, even momentarily, could lead to unnecessary panic among traders. However, he emphasized that such a move would remain structurally bullish, as Bitcoin continues to respect its ascending trendline.
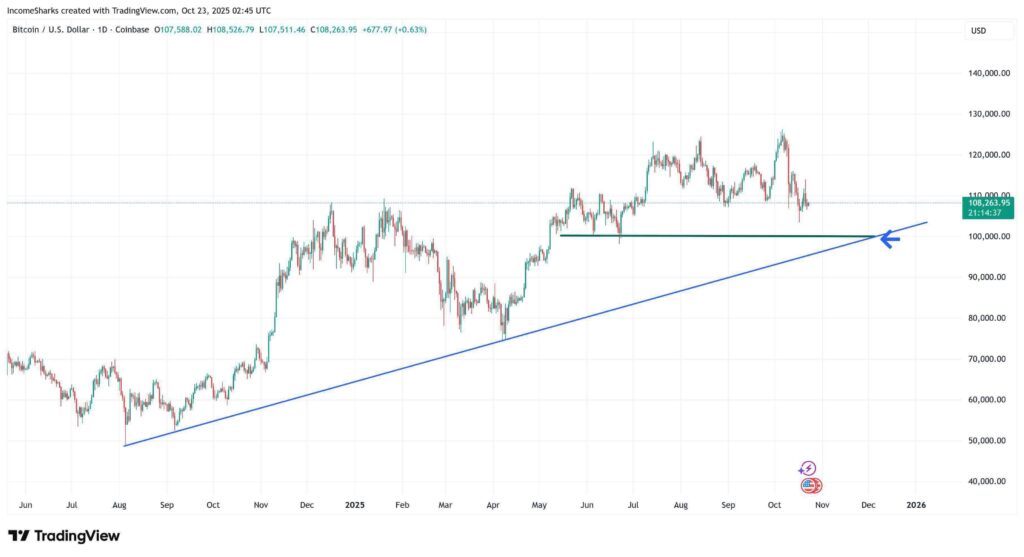
This line, established through higher lows since mid-2024, aligns with the $98,000–$100,000 range, a key area of confluence for market stability. From mid-2024 onward, Bitcoin’s trendline has acted as a backbone of support, guiding its steady rise.
Each retest of this zone has historically resulted in price rebounds, indicating persistent buying interest. The chart structure shows a consistent pattern of higher lows, confirming a resilient upward move. This technical formation shows sustained momentum, with the $100,000 area emerging as the next key level for directional bias.
$100K Level Holds
The $100,000 level also carries historical weight as a former resistance flipped into support during mid-2025. This horizontal floor supports the ascending trendline, forming a dual support structure that could determine Bitcoin’s medium-term outlook. Analysts suggest that maintaining price action above this level would likely keep the bullish framework intact.
A decisive move below this level, however, could change the short term sentiment. It may invite additional selling pressure and push the asset toward the $90,000 area. Yet, as long as Bitcoin is above both diagonal and horizontal supports, the overall trend remains consistent with long-term growth patterns seen in previous cycles.
CPI Expectations Add Short-Term Price Volatility
Another analyst, Killa, noted potential short-term movements tied to upcoming U.S. inflation data. He noted that Bitcoin is entering this Consumer Price Index (CPI) event after a decline, rather than a rally, a change from previous patterns. According to him, this setup could allow a short-term push toward $110,000–$111,000 if no delays occur due to the government shutdown.
This divergence between long-term structure and short-term catalysts outlines Bitcoin’s mixed technical outlook. While broader momentum is intact above $100,000, near-term volatility around macroeconomic events could test trader sentiment before the next significant move unfolds.