
- Javon Marks predicts Bitcoin could climb toward $165,745 as bullish divergences strengthen despite recent market pullbacks.
- Vivek Sen compares 2025 Bitcoin structure to 2017, noting consolidation before potential parabolic growth toward $200,000.
- Key resistance at $118,652 may unlock higher targets, while $95K–$100K is the key support zone for Bitcoin.
Bitcoin is consolidating below $118,652 after recovering strongly from its 2022 downturn, with analysts indicating technical structures that could influence its next move. The crypto currently trades at $112,602, maintaining a bullish sequence of higher lows established since early 2023. Analysts note that this formation, supported by repeated divergence signals, suggests underlying accumulation despite recent volatility.
Long Term Bullish Outlook
According to analyst Javon Marks, Bitcoin’s recent pullback may be temporary, with projections extending toward $165,745 if momentum strengthens. He emphasized that “the numbers and data itself in Bitcoin” point toward an eventual surge to new all-time highs.
The RSI shows a “modern bull divergence,” where momentum forms higher lows as price consolidates. These divergences appeared earlier in the recovery rally and again during the latest dip.
Historically, this setup suggests buyers are absorbing supply and building a foundation for continuation. Long term resistance is at $186,745, while key support is at $47,579, framing the broader cycle.

Structural Similarities to the 2017 Rally
Analyst Vivek Sen noted recurring market patterns that align with Bitcoin’s earlier cycle. In 2017, Bitcoin consolidated between $2,500 and $3,000 before breaking out and rallying beyond $16,500 within months.
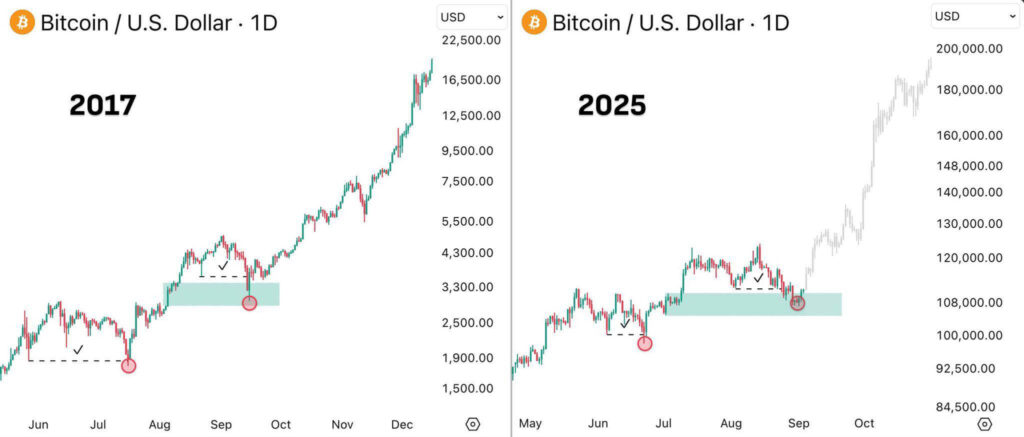
In 2025, a similar setup formed as Bitcoin stabilized between $95,000 and $108,000. A correction tested $105,000–$110,000 before the market began consolidating again. Sen remarked, “Same story every single time. Bitcoin is about to go parabolic,” emphasizing the repeating structural look.
Resistance Levels
Current levels are key, with the $118,652 resistance zone acting as a key barrier to sustained upside momentum. A decisive break above this level could accelerate movement toward the $160,000–$200,000 range predicted by analysts.
However, if the structure weakens, a deeper test of $95,000–$100,000 is possible, though the higher low sequence still supports a longer term uptrend. These outlook shows past consolidation phases preceded substantial rallies, strengthening the case for continued bullish potential.