
- Crypto Patel sees $110-$115 as key resistance, with a confirmed breakout potentially targeting $140, $200 and a new ATH.
- Ella identifies $98.5-$100 as support, while acceptance above $106 could open $109-$110.5.
- Mixed spot flows keep SOL’s direction uncertain, with a break below $99 potentially exposing $96 and lower levels.
Solana faces resistance near $110 after failing to hold its latest move toward $105–$106. Analysts Crypto Patel and Ella, a partner at LBank, outlined key levels for both outcomes. Meanwhile, spot-flow data from September 1 to 13 showed mixed activity as SOL slipped toward $99–$100.
Analysts Mark Resistance and Support Levels
Crypto Patel identified $110–$115 as the main resistance zone. He said a weekly close above that range, followed by a successful retest, could confirm renewed bullish momentum. He listed $140, $200, and a possible new all-time high as levels to monitor.
However, Patel also described a rejection scenario. If sellers regain control, SOL could fall toward $80–$70. A deeper decline toward $50 could become an accumulation area after the market forms a strong base. His long-term projections range from $500 to $1,000, although he stressed that these are not guaranteed outcomes.
Ella placed support between $98.5 and $100. According to her, daily acceptance above $106 would bring $109–$110.5 into focus. A daily close below $98 could expose $94.5–$96. She described the current movement as consolidation after expansion until either side confirms.
SOL Price Retreats After September Rebound
SOL started the period near $101–$103 before falling toward $97.5–$98 on September 2. The recovery strengthened around September 5 and 6, pushing SOL above $105. It then reached approximately $107–$107.5.
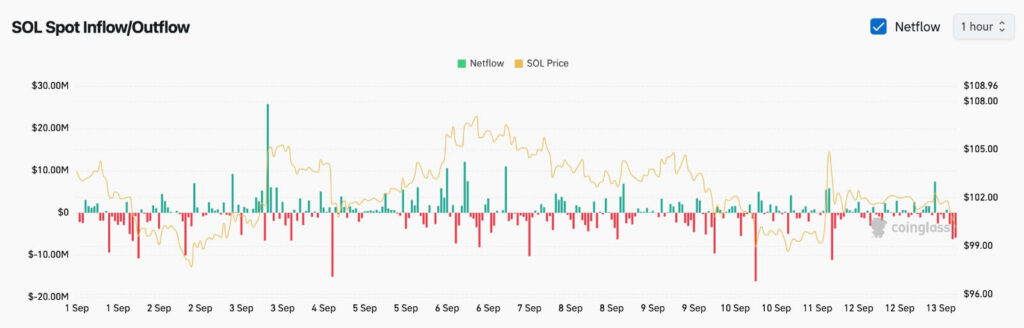
The advance coincided with positive spot-flow spikes. An inflow exceeded $20 million around September 3. Other inflows ranged from $5 million to $12 million around September 6.
The price later reversed, dropping toward $101–$102 by September 8 and 9. SOL then weakened toward $99 around September 10. The chart recorded outflows near $17 million and $11 million on September 10 and 11.
Spot Flows Keep the Next Move Unclear
An inflow near $5–$6 million on September 11 briefly lifted SOL toward $104–$105. However, the rebound failed, and SOL returned toward $100–$101 before ending near $99–$100 on September 13.
Sustained inflows could support a recovery toward $102, followed by $105–$107. However, continued negative flows and a break below $99 could expose $96.