
- Analyst Ted links the latest Blood Moon to potential Bitcoin weakness, cautioning about a correction below $100K.
- Bitcoin faces resistance near $115K while $110K acts as key support after peaking at $125K earlier in 2025.
- RSI shows neutral momentum at 46.39 while MACD crossover hints at early bullish pressure amid cooling volumes.
Bitcoin is trading at $111,178 after peaking near $125,000 earlier in 2025, with analyst cautioning about potential downside risks. According to analyst Ted, every “Blood Moon” since May 2021 has coincided with bearish moves for Bitcoin and altcoins.
He suggested another correction could unfold during the current lunar event, warning of a likely drop below $100,000. The market is in a key phase as technical signals and historical cycles show conflicting trends.
Historical Structure and Long Term Cycle Behavior
From the left side of the chart, Bitcoin peaked near $69,000 in late 2021 before entering a steep decline through 2022. A secondary high developed near $48,000 in early 2022, followed by a prolonged bear market bottoming around $16,000–$18,000.
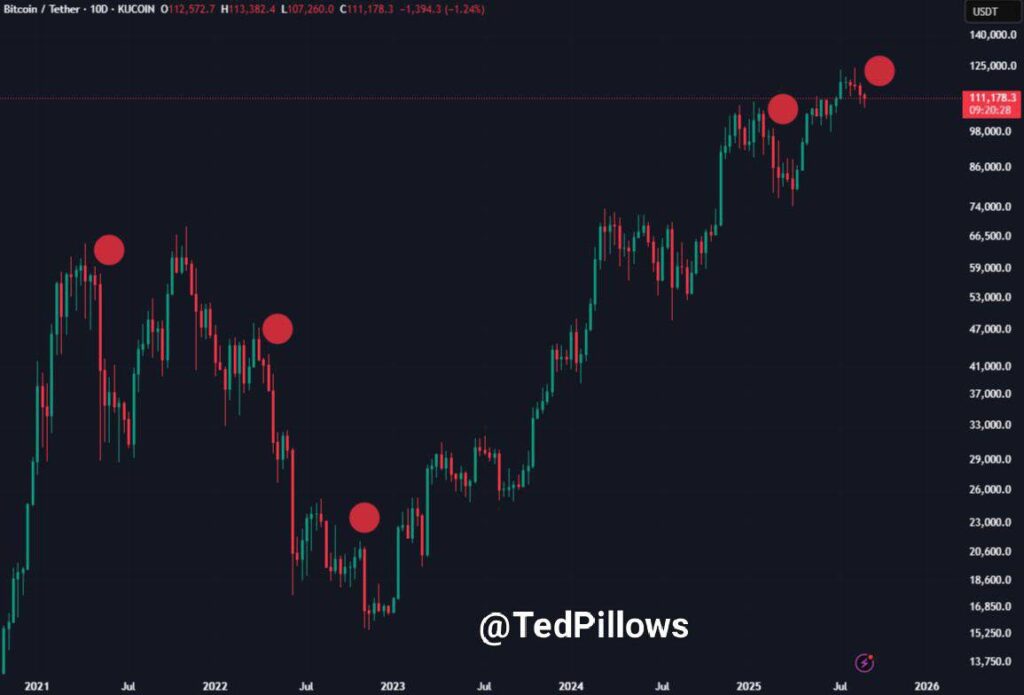
This pattern displayed a boom bust sequence where euphoria was followed by capitulation. However, outlook changed in 2023 as Bitcoin entered an accumulation phase and began a steady recovery.
The asset moved past $30,000, $47,000, and $66,500 before breaking its previous record high in mid 2024. Recent advances carried prices above $125,000 in 2025, where the chart shows a potential macro peak with a red indicator.
Resistance Levels and Support Zones
Bitcoin had strong selling pressure near $74,000 in mid 2024 and again between $111,000 and $115,000 in early 2025. These barriers show the psychological and structural hurdles influencing price behavior.
The $110,000 level has acted as immediate support following the correction from $125,000. Analysts note that sustaining this zone could enable retests of $115,000–$120,000.
However, if Bitcoin breaks below $105,000, downside exposure toward $98,000–$100,000 becomes highly probable. A deeper retracement could extend toward $74,000, aligning with prior cycle corrections of 30–50%.
Technical Indicators Point to Neutral Momentum
The RSI Is at 46.39, with a signal line at 42.81, placing Bitcoin in neutral level. These levels remain below the overbought threshold of 70, suggesting consolidation rather than trend exhaustion.
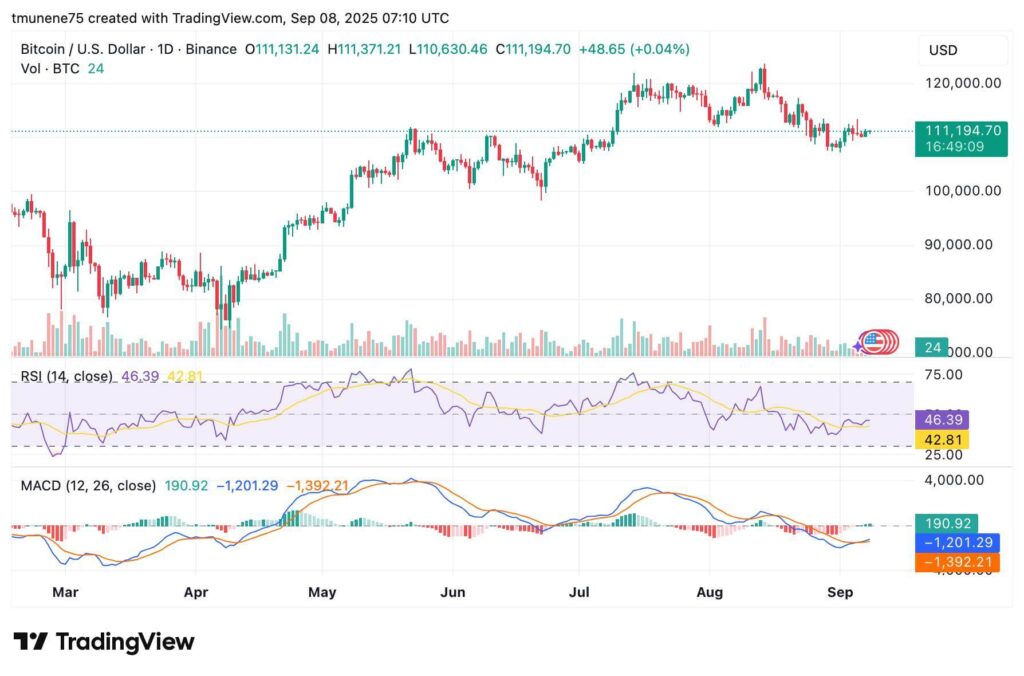
At the same time, the MACD line is at 190.92, above the signal line of -1,201.29, with histogram values shifting positive. This crossover shows the early stages of potential bullish momentum after recent selling pressure. Volume has cooled compared to the May–July surge, showing a pause as traders await clearer direction.
Bitcoin’s movement is defined by higher highs and higher lows since 2023. Yet clustered red markers at previous peaks show caution, supporting the view that the market may be entering distribution before its next decisive move.