- Analyst says XRP RSI reached oversold levels last seen during the 2022 bear market bottom.
- XRP trades near $1.39 with key support at $1.30–$1.35 and resistance between $1.45 and $1.70.
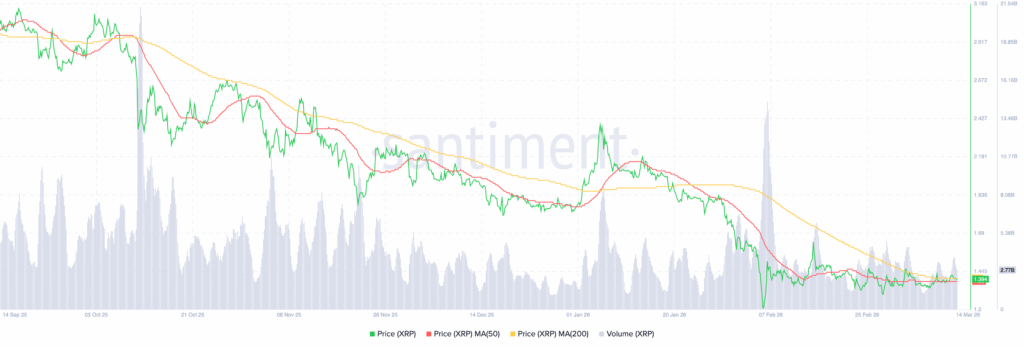
- Price has declined from about $3.10 since Sept 2025, forming a prolonged downward trend.
XRP trades near $1.39 after months of decline. Market commentator Doctor Profit stated that the asset appears heavily undervalued as the Relative Strength Index reaches oversold territory. According to the analyst, the signal resembles conditions seen during the December 2022 market bottom.
Analyst Points To Extreme RSI Levels
Doctor Profit shared the observation while reviewing XRP’s latest technical indicators. According to the analyst, the RSI recently reached levels last seen during the 2022 bear market bottom.
He wrote that XRP appears “criminally undervalued” under current conditions. The analyst also noted that a buy signal previously appeared near the $1.37 level.
According to Doctor Profit, the signal suggests higher prices may emerge within the coming weeks. However, price action still depends on support levels holding.
The statement came as traders examined momentum indicators and support zones closely. Therefore, attention shifted toward how XRP behaved around current levels.
Long Consolidation Preceded Major Breakout
Earlier market activity shows XRP spent years inside a narrow accumulation range. Between 2022 and mid-2024, the price traded mainly between $0.30 and $0.60. Buyers repeatedly defended that support band, forming a prolonged consolidation phase. Eventually, a strong breakout followed during 2025.
The rally pushed XRP above $2.00 and later toward $3.30 to $3.40. That move reflected strong momentum and broader market participation. However, the trend later reversed. The market began a gradual pullback toward the $1.37 region, which now acts as a support area.
Notably, this zone aligns with a rising moving average and earlier resistance levels. As a result, traders watch this level closely.
Price Decline Forms Extended Downtrend
Since September 2025, XRP has moved within a sustained downward trend. The price fell from about $3.10 to near $1.39 by March 2026. Technical charts show a sequence of lower highs and lower lows. Meanwhile, the 50-day moving average remains below the 200-day average.
This structure confirms continued bearish pressure. Volume data also shows spikes during major sell-offs. For example, heavy selling appeared in early February 2026. During that period, XRP briefly dropped near $1.25 before stabilizing.
Currently, the market trades between $1.35 and $1.40. Support appears near $1.30–$1.35, while resistance is around $1.45 to $1.70. If price rises above $1.70, analysts note that a move toward $2.00 could follow. However, losing $1.30 could expose another decline near $1.20.