- SHIB forms a descending wedge pattern, signaling tightening structure and possible breakout.
- Bullish MACD divergence indicates fading bearish momentum and rising buyer strength at support.
- Analysts say SHIB could climb hundreds of percent if resistance breaks with strong trading volume.
Shiba Inu (SHIB) is showing tightening market activity, suggesting a potential breakout against Bitcoin as a bullish divergence forms. Technical data indicates growing strength at current levels while the asset trades near long-term support. Market analysts suggest that this structure could support a substantial upward movement if momentum continues to build.
Descending Wedge Formation and Technical Indicators
According to analysis prepared by Javon Marks, SHIB has been developing a descending wedge pattern since reaching its peak in 2021. The price has recorded lower highs while maintaining stable support near the base, reflecting steady market compression. The formation indicates reduced volatility as the price approaches the wedge’s apex, signaling potential expansion.
The MACD indicator shows a bullish divergence, where momentum forms higher lows while price remains near the base level. This setup indicates fading bearish pressure and increasing buyer interest. Data from CoinGecko places SHIB at $0.000009629, reflecting an 8.2% decline over the week but maintaining a $5.67 billion market capitalization. The 24 hour trading volume of $139.77 million shows a regular liquidity in major exchanges.
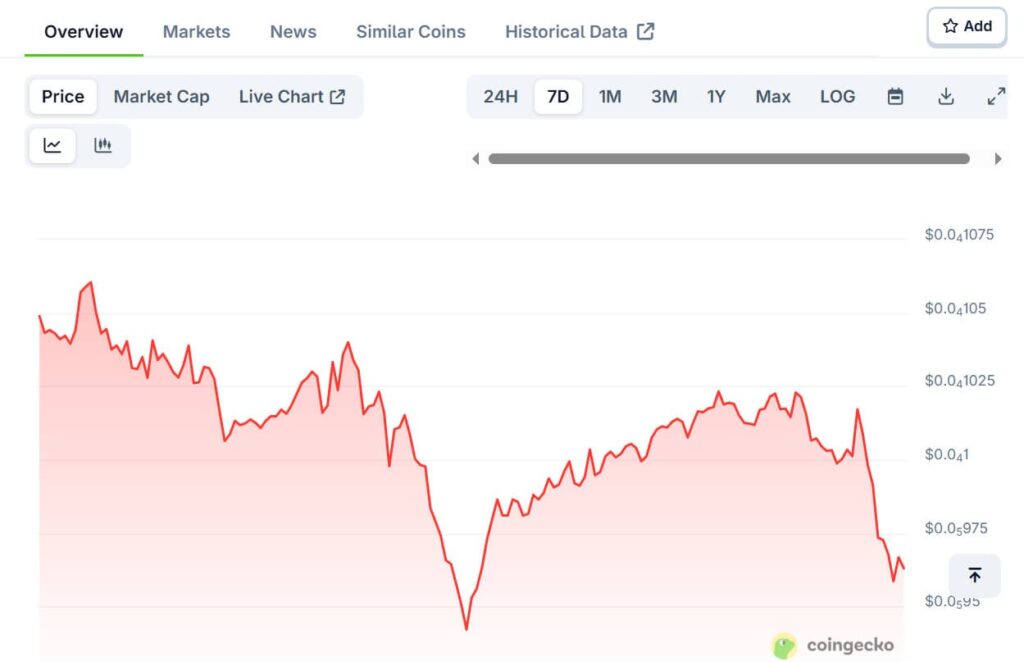
Trading within the range of $0.000009586 and $0.00001023, SHIB continues to display moderate volatility. The general structure remains intact which implies an accumulation around the existing support levels. Analysts note that compression within the wedge pattern could lead to a breakout once volume and market participation increase.
Market Cycle and Breakout Potential
According to an observation by IncomeSharks, SHIB’s market behavior over the past two years reveals alternating rallies and extended bearish phases. The first upward cycle lasted one month, followed by a six-month decline, then a three-month recovery, and an eleven-month consolidation period.
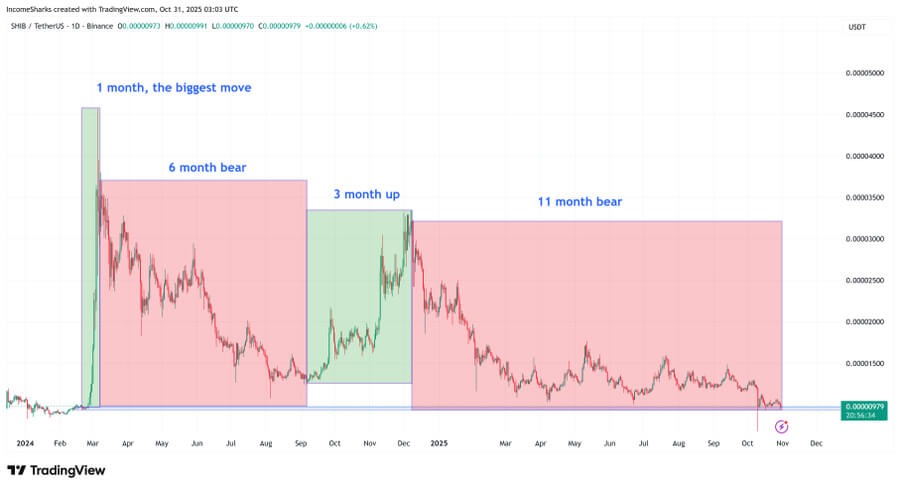
These cycles display defined market behavior with measurable durations. SHIB is now exhibiting conditions similar to previous accumulation phases, holding a bullish divergence against Bitcoin.
Analysts believe that if resistance levels break with higher trading volume, Shiba Inu could climb hundreds of percent higher. The current compression phase, combined with historical accumulation patterns, forms a setup suggesting that SHIB is on track for a potential breakout supported by renewed demand strength.