
- Analyst projects $1,300 for BNB as price tests the $990 resistance zone after breaking key levels since 2023.
- Support levels are firm at $900, $850, and $750, with $650 acting as a key long term pivot for the uptrend.
- RSI at 71.59 and MACD acceleration show strong momentum, with trading volumes supporting potential continuation higher.
Binance Coin is pressing against key resistance after a prolonged consolidation phase that shaped its market moves since 2022. The price has steadily advanced following a breakout above $650 in 2023, supported by a base built between $250 and $400.

This change marked a decisive move into sustained upward momentum, carrying BNB closer to four digit valuations. According to analyst Ali, the ongoing breakout could extend toward $1,300 if current levels are breached.
Long Term Resistance Zones
At press time, BNB was trading at $941.11, gaining by 3.73% on the day and hitting an intraday high of $943.46. This strength places the token just below the $990 barrier, which has acted as a major resistance zone.
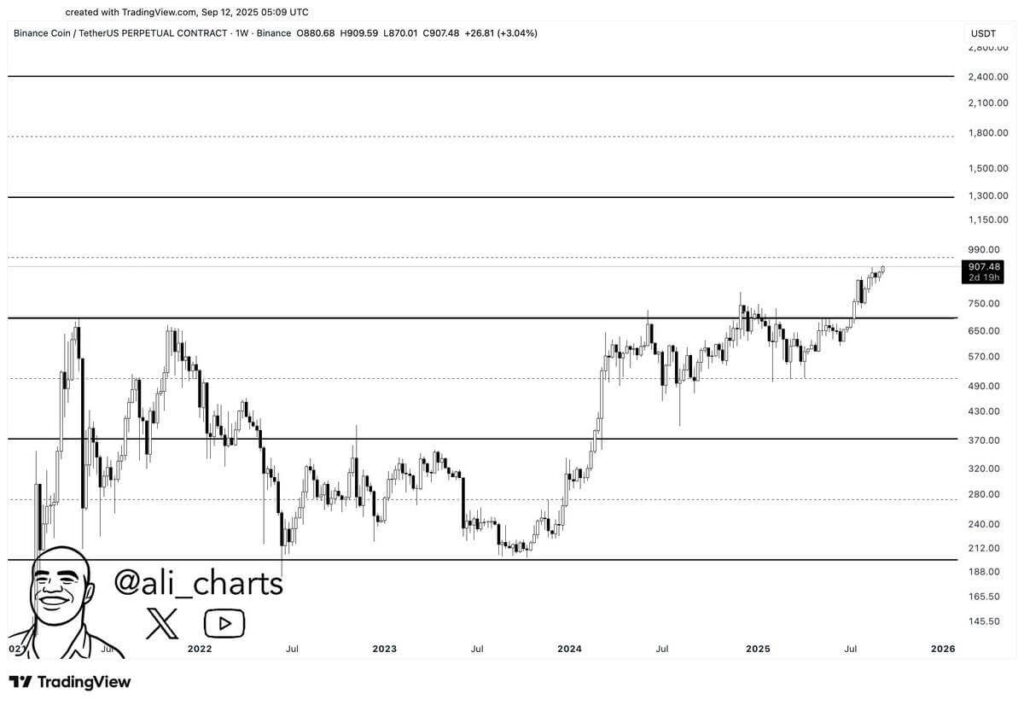
This level aligns with prior market behavior, where selling pressure previously capped rallies. A confirmed move higher would position $1,300 as the next notable level. Medium term predictions show further resistance around $1,800 and $2,400.
Supports Remain Beneath Current Levels
On the downside, support is near $900, followed by $850. Broader structural supports are at $750 and $570, both tested during past cycles. Importantly, $650 now acts as a long term level, with sustained strength above it maintaining the overall bullish framework. However, any failure to hold the $750 level could lead to corrective pullbacks, though the larger trend continues to favor upside.
Indicators Show Strong Momentum
Momentum indicators show persistent strength. The RSI is at 71.59, showing overbought conditions yet emphasizing bullish energy. The RSI moving average line at 58.44 shows extended upward pressure.
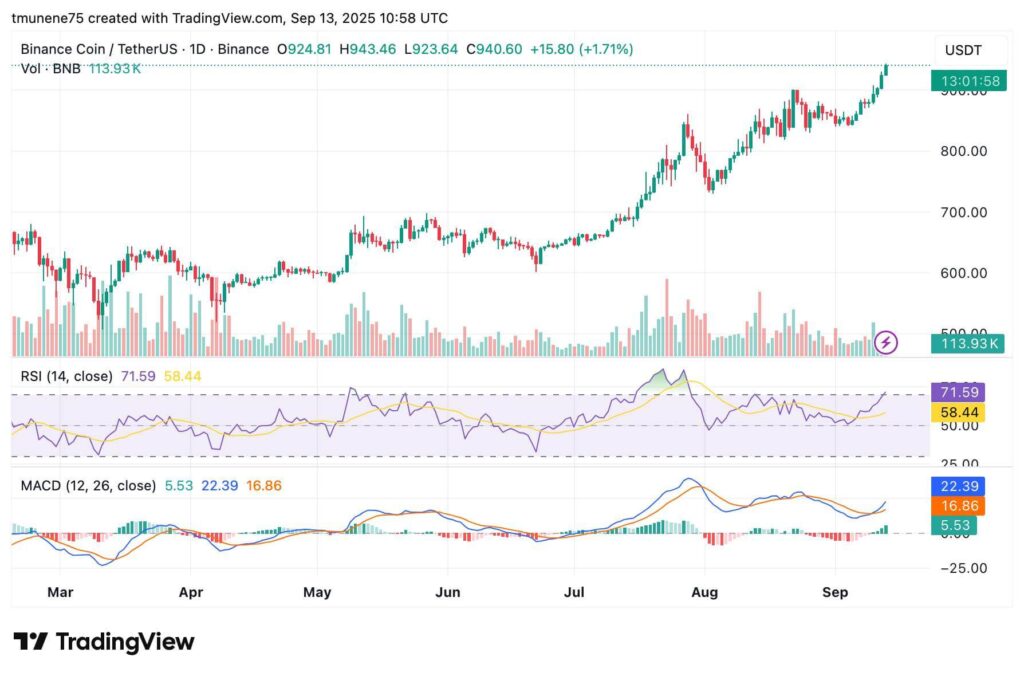
The MACD also confirms acceleration, with the line reading 22.39 compared to the 16.86 signal line. A positive histogram of 5.53 further supports ongoing momentum. Trading volume trends add another layer of confirmation.
Breakouts have been accompanied by notable spikes, showing active participation across recent advances. With $1,000 as the next psychological resistance, continuation beyond this mark could align with the analyst’s projected target of $1,300.