
- SEI trades between $0.27–$0.31, with $0.27300 acting as immediate support and $0.31000 as key resistance.
- RSI at 44.94 and converging MACD lines indicate weakening momentum but potential signs of price stabilization.
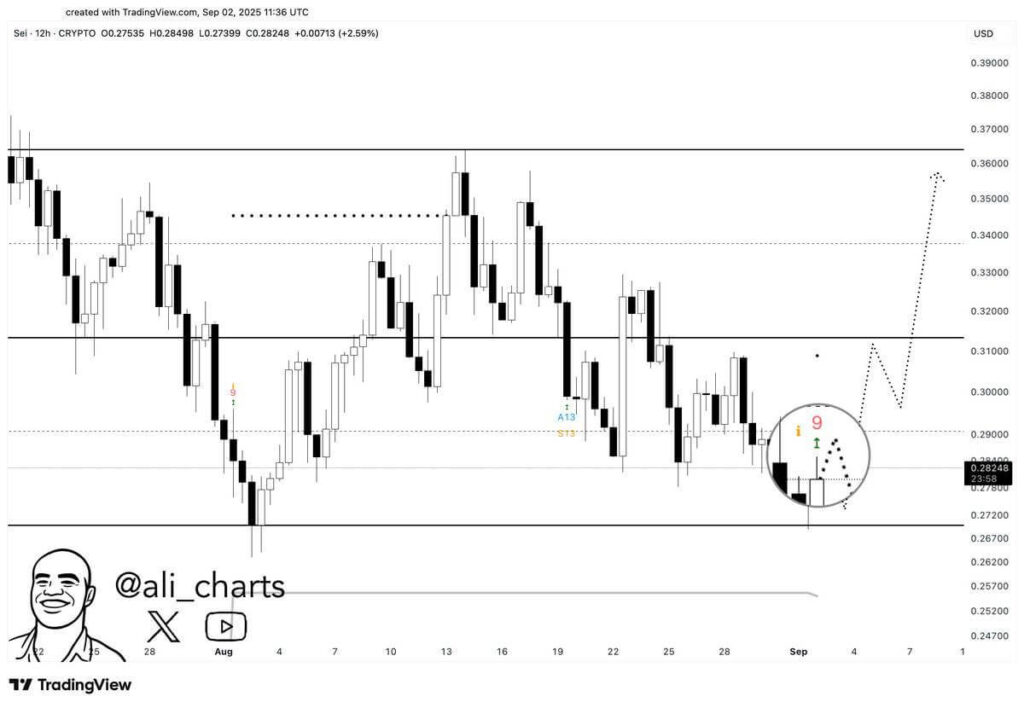
- Analyst Ali notes a buy signal, projecting SEI could rally toward $0.37 if support levels remain intact.
SEI is showing early signs of recovery after testing the lower edge of its trading channel. According to analyst Ali, the token recently displayed a buy signal at the bottom of this range, hinting at a possible rebound toward $0.37. The current setup highlights a delicate balance between short-term support and resistance levels, where a shift in momentum could define the next price direction.
Support and Resistance Levels
The immediate support is near $0.27300, where SEI recently bounced, while the key downside level is around $0.26800–$0.27000. This zone aligns with earlier lows and is vital for defending bullish potential.
If sustained, the price could retest immediate resistance at $0.31000, which has repeatedly capped upward movements. Above this level, the next resistance is between $0.35000 and $0.36000, coinciding with July’s peak near $0.35.
The broader picture shows SEI consolidating between $0.27 and $0.31 after retracing from its earlier highs. However, losing current support risks reopening a path toward the $0.2500 region.
Indicators Show Weakness but Hint at Stabilization
The RSI is at 44.94, remaining below the neutral 50 mark. This suggests weaker momentum, although it avoids oversold levels, which begins below 30. Since August, the RSI has gradually declined, pointing to persistent selling pressure.
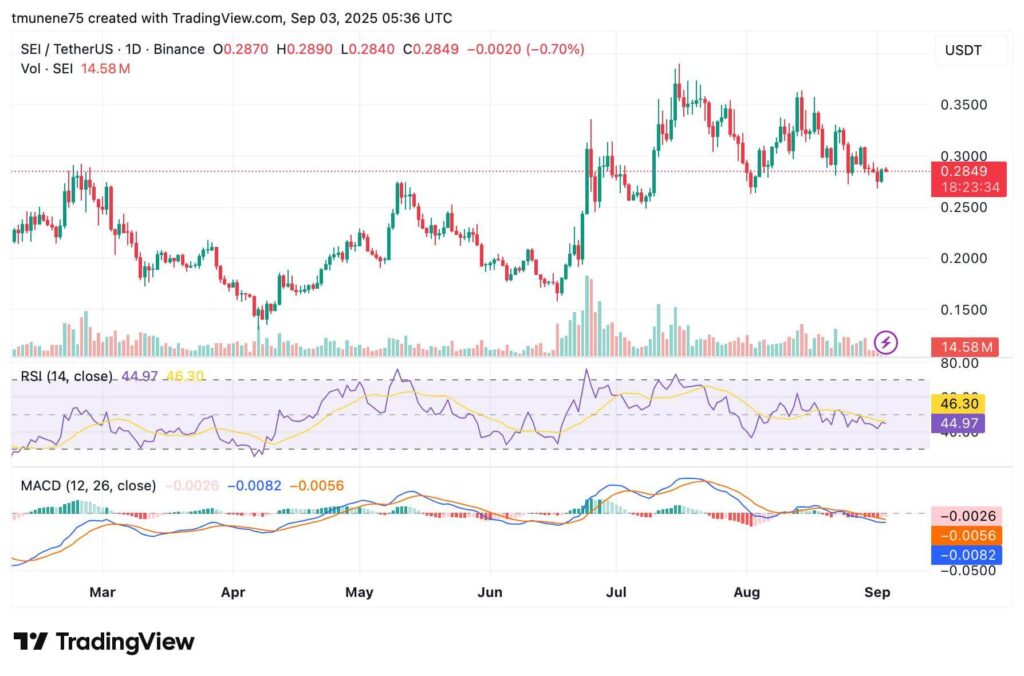
Meanwhile, the MACD is negative with a reading of -0.0082 against a signal line at -0.0056. The histogram is at -0.0026, showing ongoing bearish bias. However, both lines are beginning to converge, which often points to stabilization or early signs of shifting momentum.
Volume patterns add context, with daily activity now at 14.58 million. This is notably subdued compared to July’s spikes, suggesting limited conviction from buyers or sellers at the moment.
Price Structure and Potential Paths
Candlestick formations around support levels are showing small bodied candles, often linked to a slowdown in selling pressure. Within this context, the “9” marker from a sequential indicator suggests potential exhaustion among sellers, further supporting the prospect of a rebound.
Analyst Ali emphasized that if SEI continues holding above $0.27300, price could first retest $0.31000. A decisive break beyond this level may open space toward $0.33000 and the $0.35000 range. Alternatively, failure to sustain support leaves $0.26800 as the next crucial test before any broader decline.