
- JasmyCoin is consolidating near $0.01952, forming a bullish “cup and handle” pattern, signaling a possible breakout rally.
- Analyst projects JASMY to surge by 1,590%, targeting $0.31877 if it breaks out of consolidation, supported by low volume.
- Golden Cross on the 4-hour chart reinforces bullish momentum, with the 50 EMA at $0.02008 acting as support.
According to analyst JavonTM1 on X, JasmyCoin (JASMY) is poised for a major price movement, with the projection suggesting a possible surge of more than 1,640%. Currently trading at $0.02015, JASMY remains in a consolidation phase, but the setup shows a bullish pattern that may lead to a breakout and a strong rally to $0.35 or higher.
Consolidation Phase Signals Accumulation
JasmyCoin has been stabilizing around the $0.02015 mark, which indicates a period of consolidation after a previous decline. This sideways movement suggests that the market could be in accumulation mode. Monitoring of the $0.019 support level is crucial as it has proven to be a significant zone for buyers. The price has bounced from this level several times, reinforcing its strength.
Notably, the current consolidation aligns with a classic “cup and handle” pattern. This technical formation, often seen as a bullish signal, suggests a future breakout. The “cup” portion, observed from March to October 2024, shows a rounded price movement, while the “handle” is forming now as the price consolidates in a narrow range.
Price Projection Highlights Bullish Potential
The analyst has projected that once the price breaks out of the consolidation zone, a sharp rally could follow, pushing JASMY toward $0.31877, representing a 1,590.29% increase from its current price. The volume analysis supports this potential move, as the lower trading volume during consolidation is typical before a breakout.
A spike in volume would confirm the breakout, leading to a bullish move. However, if JASMY fails to break out and drops below the $0.019 support level, the bullish outlook could be invalidated, and a bearish trend may emerge.
EMA Crossover Confirms Bullish Sentiment
On the 4-hour timeframe, a bullish crossover, commonly known as a “Golden Cross,” has formed, with the 50 EMA crossing above the 200 EMA. This crossover indicates upward momentum, with the price currently trading above both EMAs.
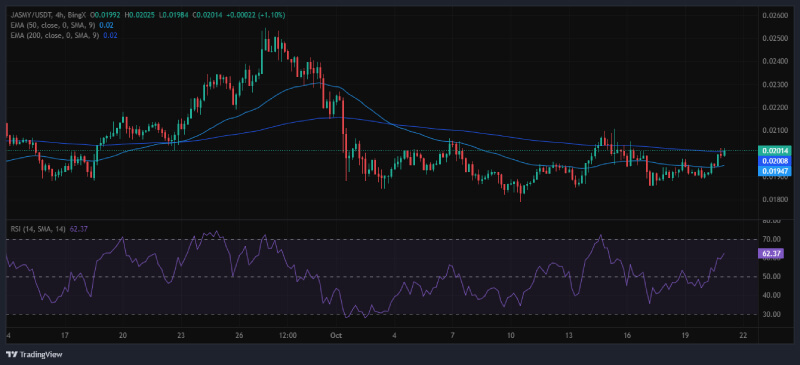
The 50 EMA, now acting as support at $0.02008, and the 200 EMA at $0.01947, further reinforce this bullish momentum. Additionally, the Relative Strength Index (RSI) currently stands at 62.62, signaling strong upward momentum without reaching overbought conditions.