
- Ethereum’s $3,500 support is key; holding this level may confirm a bullish setup and prevent a deeper decline.
- ETH’s Elliott Wave suggests it’s in Wave 2, with Wave 3 targeting a rally past $4,800 if support zones hold.
- A break above $3,800 resistance would confirm trend continuation, while failure could send ETH back to $3,200 or lower.
Ethereum’s market behavior has raised attention, with analysts pointing to familiar price action near the $3,500 level. After peaking close to $3,900, ETH retraced sharply by about 10%, now trading at $3,553.87.
Despite the pullback, Ethereum is above the earlier breakout level, a zone considered significant for confirming bullish momentum. Analysts caution that the current movement resembles previous patterns seen around $2,400, where a deep red candle led to panic, only for prices to recover shortly after.
This apparent “fakeout” has shifted attention to support levels, particularly the $3,500 region, which must hold to prevent deeper declines. Analysts emphasize that panic selling at local lows often results in missed opportunities.
Historical price behavior supports this view, as Ethereum previously rebounded after similar selloffs. The recent dip may be testing support rather than confirming a breakdown.
Downtrend Reversal and Breakout Confirmation
Ethereum’s bullish reversal can be traced back to late May when the price broke out of a defined descending resistance. Prior to this, ETH followed a prolonged downtrend, with lower highs marking the decline.
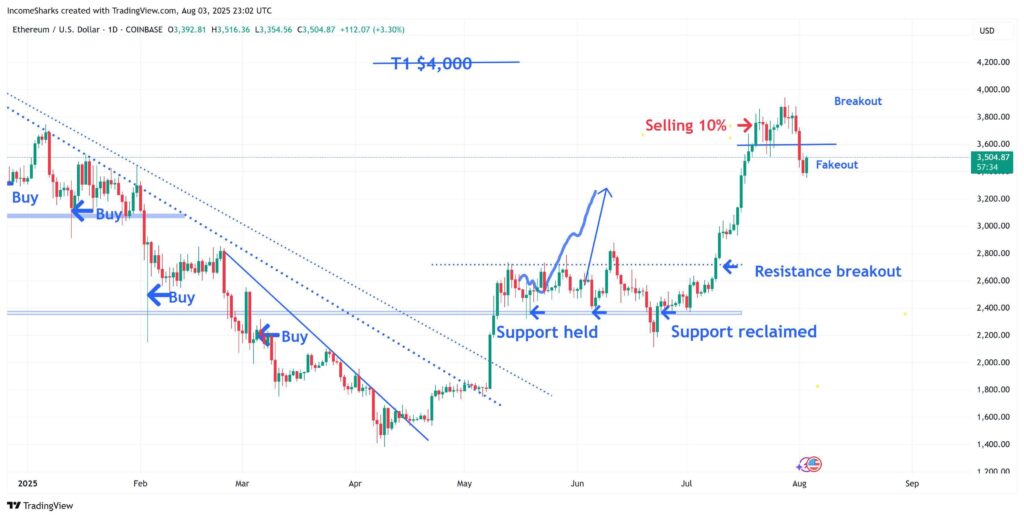
The breakout above $2,600 signaled the shift, led by multiple support bounces between $2,400 and $2,600. These levels, previously key zones for accumulation, helped establish a solid foundation.
The breakout rally carried Ethereum past $3,800, a notable resistance level, and briefly near $3,900. Despite the recent pullback, ETH still trades above the former resistance. This area now acts as immediate support and is key for bulls to maintain control. The next challenge is in reclaiming the $3,800–$4,000 range, where previous attempts to break higher failed.
Wave Structure Suggests Impulse Formation
According to RJT WAGMI, ETH may be forming a five wave pattern similar to the 2023 cycle. Back then, the price moved from $1,250 to over $4,200, completing a textbook five wave impulse. Wave 3 led the strongest rally, and Wave 5 marked the final push before a correction.
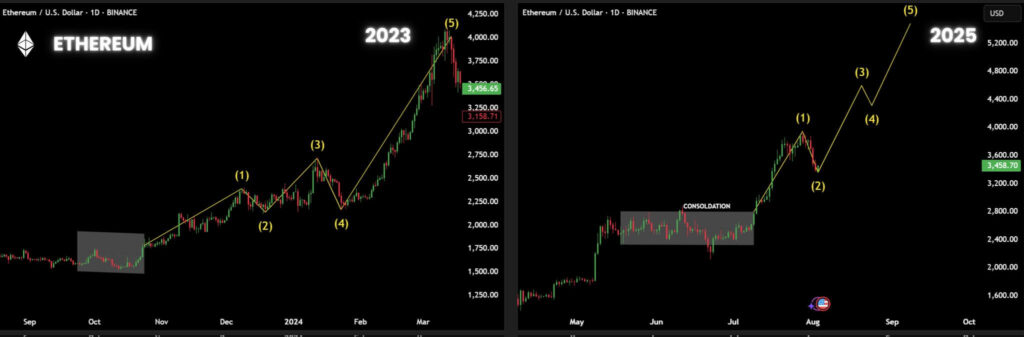
Current trend shows Ethereum in Wave 2 of a five wave trend which is forecasted. Wave 1 moved from $2,400 to $3,800, and Wave 2 is now correcting around $3,458.70. Forecasters are expecting Wave 3 to continue further past $4,800, with Wave 5 reaching up to $5,200. Pivotal support for this trend is between $3,150 and $3,200. Crossing above $3,800 would verify the continuation of this trend.
Key Zones Define Market Outlook
Despite short term volatility, Ethereum price forecast continues to possess an overall bullish setup. The $3,500 level is now near immediate support, whereas $3,800-$4,000 is resistance. Far support lies between $2,800 and $2,600, the previous breakout region.
Volume confirmation and price response at these levels will play a pivotal role in Ethereum’s next direction. The price staying above $3,500 and piercing $3,800 for the second time can help the trend move to $4,000 and beyond. Losing support, on the other hand, can result in a pullback into $3,200 or even $2,800.