
- TIA’s breakout above the trendline signals a bullish shift, with potential upside toward $7–$8 if momentum holds steady.
- The retest of the broken trendline confirms support, strengthening the case for accumulation and a sustained bullish reversal.
- Resistance near 6.000 USDT may pose hurdles, but decreasing lows and strong buyer participation support further upside.
World Of Charts recently shared an optimistic outlook on TIA, highlighting a crucial trendline breakout. After a prolonged correction, the cryptocurrency shows signs of recovery. The breakout signals a shift in sentiment, making TIA less risky compared to other altcoins. Analysts now anticipate a potential rally toward the $7–$8 range in the coming weeks.

Breakout and Market Sentiment Shift
The 12-hour candlestick chart of TIA/USDT on Binance reveals key developments. Currently, TIA trades at 3.838 USDT, marking a 6.91% increase. A descending trendline, which previously kept the price in a downtrend, has been breached. This suggests a possible end to the bearish phase.
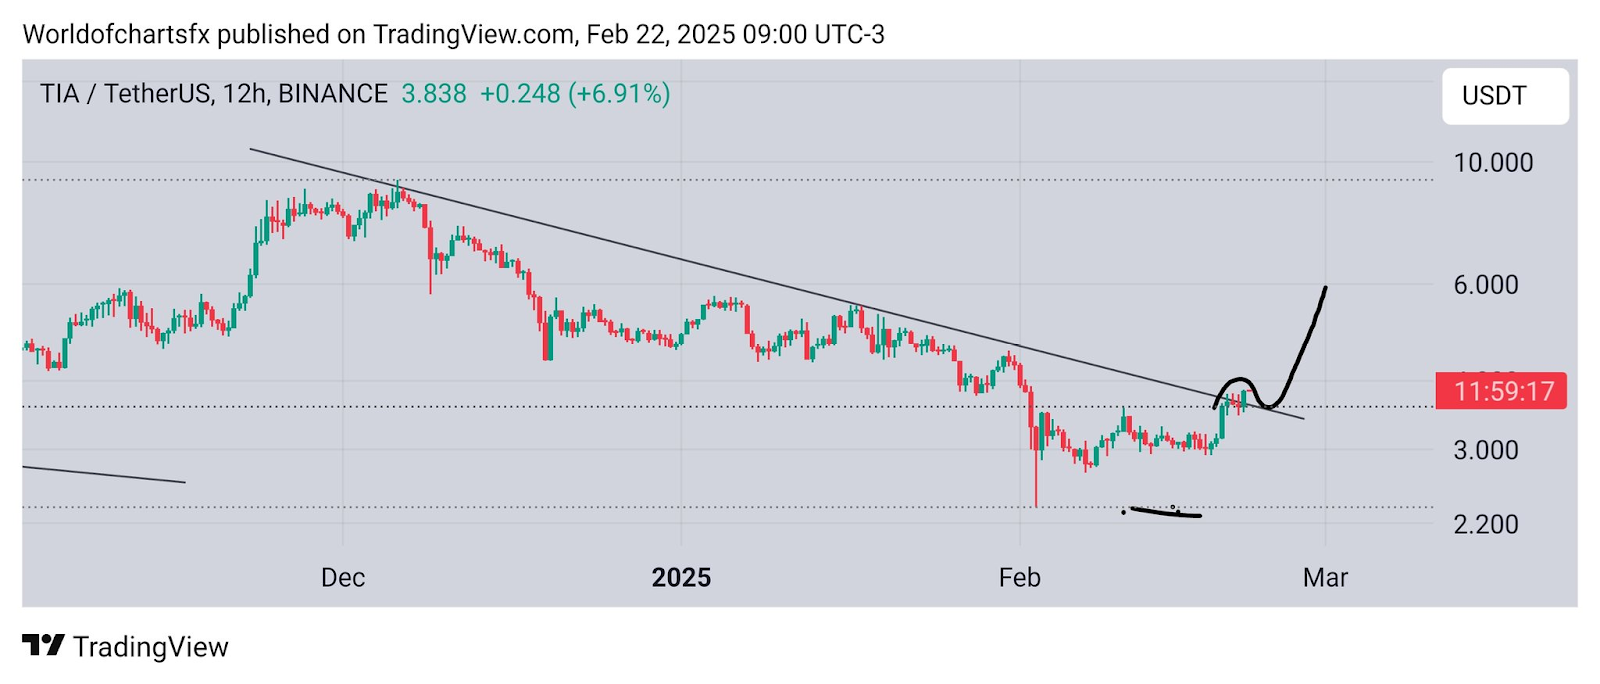
Additionally, the price retested the broken trendline, confirming support. This validation is crucial as it strengthens the bullish case. Traders often look for such confirmations before entering long positions. Moreover, the breakout aligns with a higher low formation, indicating accumulation before an upward expansion.
Potential Upside and Resistance Challenges
The next target level stands near the 6.000 USDT mark. If the buying momentum remains strong, the rally could extend further. However, resistance levels ahead may pose temporary hurdles. The breakout suggests increasing momentum, but sustaining support above the trendline is critical.
The accumulation phase in early February 2025 played a vital role. This consolidation built the foundation for the breakout, leading to the current bullish trend. A pattern of decreasing lows further supports the bullish reversal narrative.
Medium-Term Perspective and Market Structure
The 12-hour period offers a medium-term perspective. It looks as though the market structure is shifting from a bearish trend to a bullish surge. Price levels that could serve as future support or resistance zones are indicated by the presence of horizontal dotted lines.
Moreover, price movement suggests heightened market activity. Although volume data is absent, the price action itself indicates strong buyer participation. Consequently, traders should watch key levels for further confirmation of a sustained bullish move.