
- Altcoin Season Index at 78 signals strong altcoin outperformance, though history shows risk of sharp corrections.
- TOTAL3 faces key $1.2T resistance; past rejections led to pullbacks near $1T despite a long term bullish trendline.
- Breakout above $1.2T could drive altcoin market cap to $1.5T–$1.7T, while failure risks a drop toward $900B–$1T.
The Altcoin Season Index has surged past 75, entering a level that historically defines periods of stronger altcoin performance against Bitcoin. The index, ranging from 0 to 100, identifies market cycles where dominance changes between Bitcoin and altcoins.

Values above 75 indicate altcoins are outperforming Bitcoin, while levels under 25 show Bitcoin holding the lead. In recent weeks, the measure increased from the mid 30s to above 60, now touching a 78 peak zone.
This rise suggests increasing capital inflows into altcoins, suggesting that the broader market is favoring higher risk digital assets outside Bitcoin.
Altcoin Season Index Fast Surge
The Altcoin Season Index has had sharp historical swings between Bitcoin and altcoin dominance. Past readings above 75 were often followed by deep corrections into the mid 20s, confirming alternating market control.
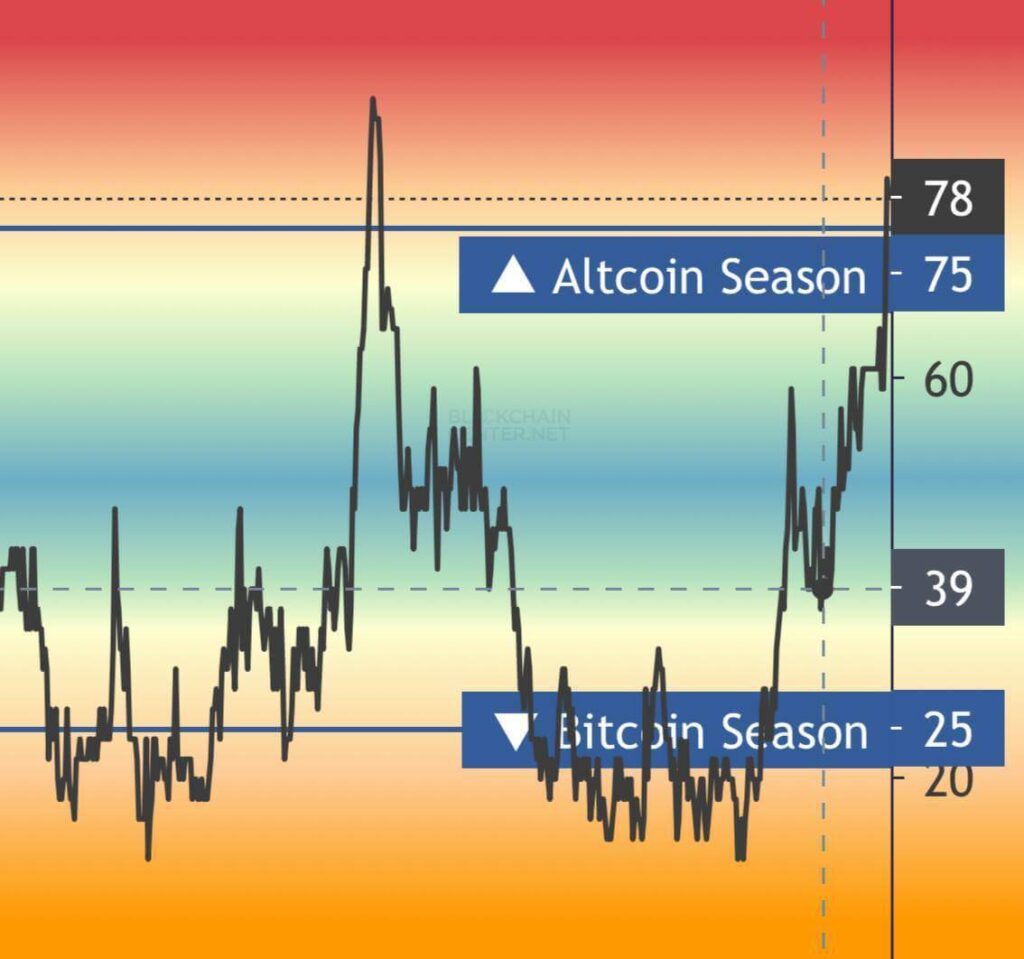
Currently, the momentum favors altcoins, with the index climbing from mid 2024 levels near 35 to the current 78 zone. This surge is one of the fastest climbs in recent cycles and shows the pace at which investors are shifting capital.
However, historical context shows that sustained performance above 75 has been difficult to maintain without broader liquidity stability in the market.
Market Cap Pressures Key Resistance
Alongside the index surge, the total crypto market cap excluding Bitcoin and Ethereum now is at $1.14 trillion. The weekly chart shows repeated tests of horizontal resistance at $1.2 trillion, marked by several rejections in 2021 and mid 2024.
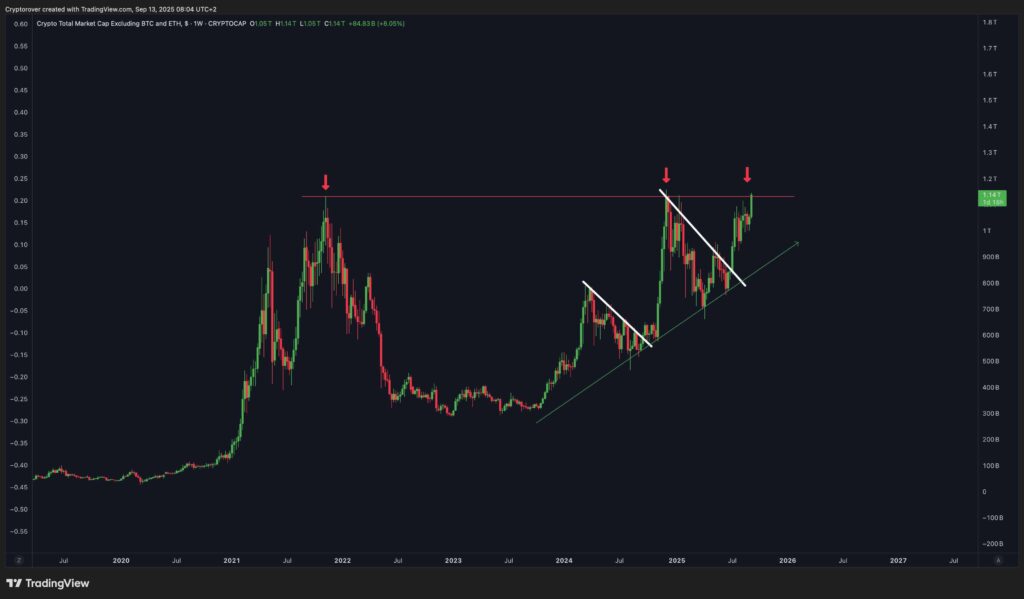
Each past rejection led to sharp corrections, often pulling valuations back toward the $1 trillion range. Despite those setbacks, an ascending trendline from late 2022 is intact, indicating higher lows over nearly three years.
The chart also has two confirmed falling wedge breakouts, both historically bullish patterns, occurring in mid 2023 and early 2025. Each of those events preceded rallies that approached the $1.2 trillion barrier again.
Analyst Notes Key Inflection Zone
The latest price action places the market at another test of this resistance level, with $1.2 trillion acting as a decisive level. According to analyst Crypto Rover, “Altcoins are about to explode,” referencing the index surge and strengthening trendline support.
Notably, if the current upward move continues, the market could revisit valuations between $1.5 trillion and $1.7 trillion. However, rejection around this resistance has previously redirected flows back to levels near $900 billion.
With altcoins already outperforming Bitcoin on the index, market focus remains on whether this barrier finally gives way.