
- Bitcoin dominance is nearing a reversal, signaling a potential altcoin surge as historical patterns point to a breakout.
- A Golden Cross forming on the weekly chart mirrors past altseasons, hinting at a bullish cycle for altcoins.
- Market trends and technical indicators suggest altcoins are gaining momentum, with a major breakout possibly on the horizon.
An analysis by Titan Of Crypto suggests that Bitcoin dominance is closing in on a key reversal zone, which could signal an altcoin resurgence. The six-week chart reflects Bitcoin’s erratic market share in an ascending triangle pattern. Dominance climbed till 2017, then plummeted in 2018. From 2019 to 2023, Bitcoin’s dominance rebounded and is now sliding down in 2024. This change portends an altseason, as altcoins continue to gain ground.
Bitcoin Dominance at a Crossroads
Dominance in Bitcoin peaked near 65% back in 2017 before considerably falling. From 2020 to 2025, dominance moved within the range between 60% and 55%, occasionally spilling over below 55%. This kind of trend implies the growing market share of altcoins. The triangle since 2017 shows the possibility of a breakout. If the dominance of Bitcoin falls further, altcoins can have huge gains.
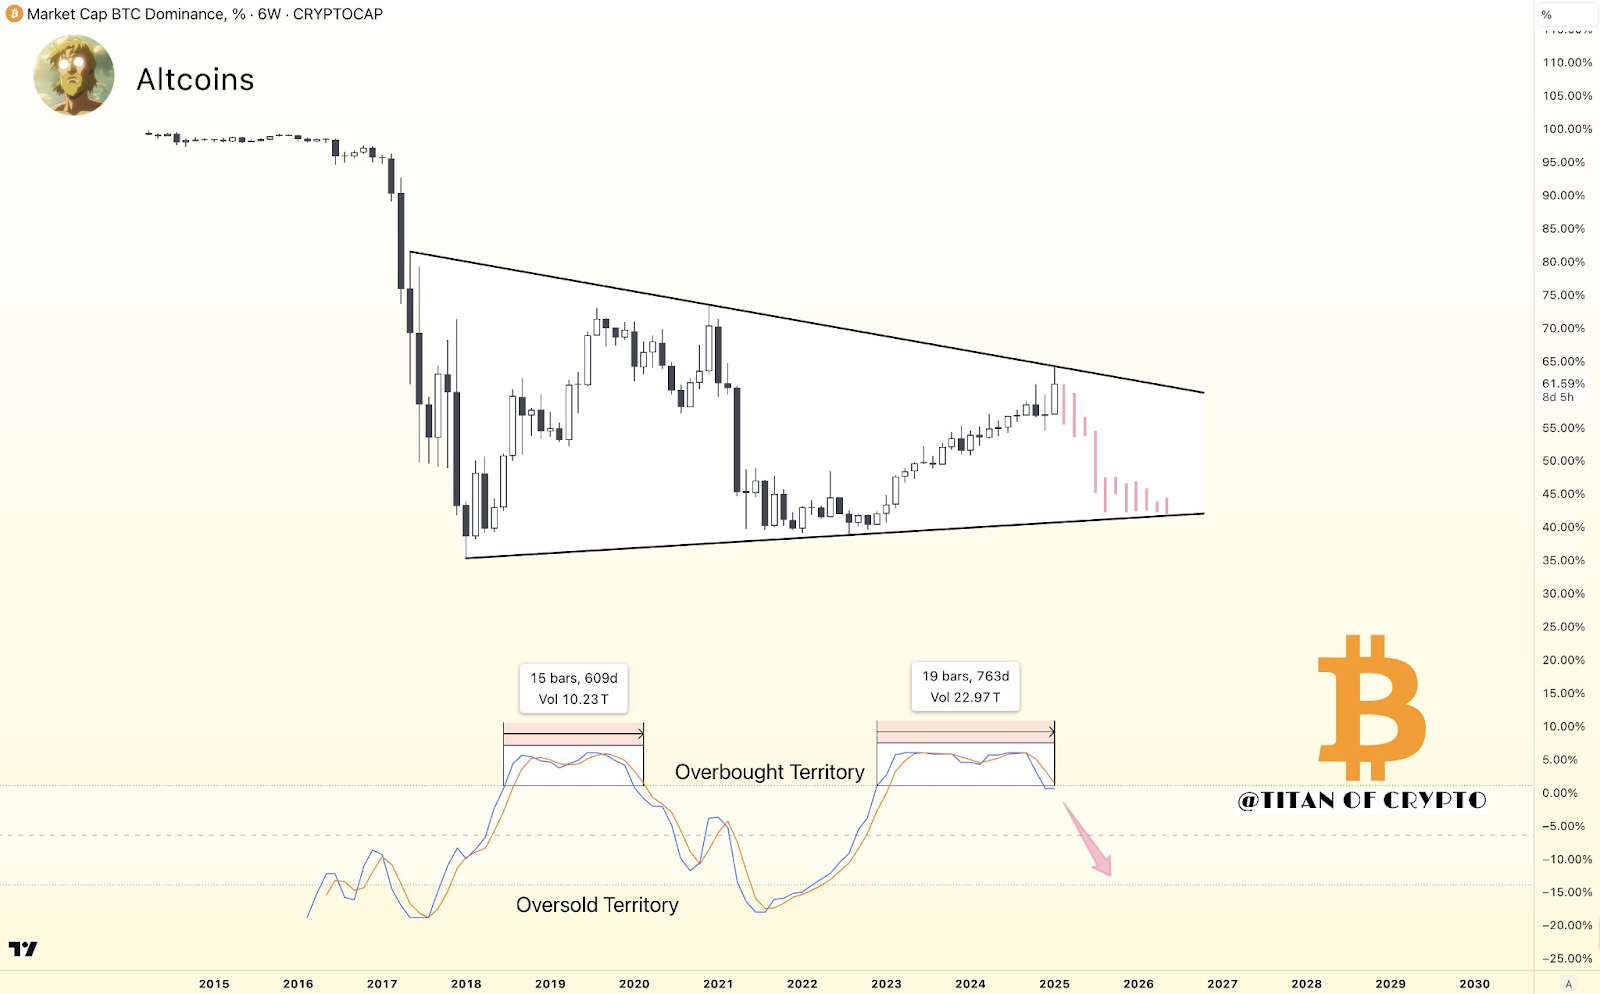
Further, the Relative Strength Index travels between overbought and oversold levels. Overbought conditions range from 70% to 100%, while at the same time, the overbought condition lies between 0% to 30%. Present RSI indications are overbought regions of Bitcoin Dominance. In that respect, the shift seems likely towards Altcoins.
Market capitalization data supports this trend. The total crypto market cap grew from 2020 to 2025. These changes in sentiment show confidence in altcoins. With the decline in Bitcoin dominance, altcoins will be in a position to siphon more of the market share.
Golden Cross Signals Imminent Altseason
A bullish “Golden Cross” is forming on the weekly chart, a rare event that previously signaled an altcoin boom. The chart tracks total cryptocurrency market capitalization excluding Bitcoin. Since 2017, a long-term resistance trendline has marked upper price boundaries. Moving averages further confirm historical trends.
In 2020, the one-hundred-day moving average crossed above the two-hundred-day moving average. An altseason commenced at this point, culminating in a parabolic rally in 2021. Following their peak, the market corrected and won several consolidating years from 2022 through 2024.
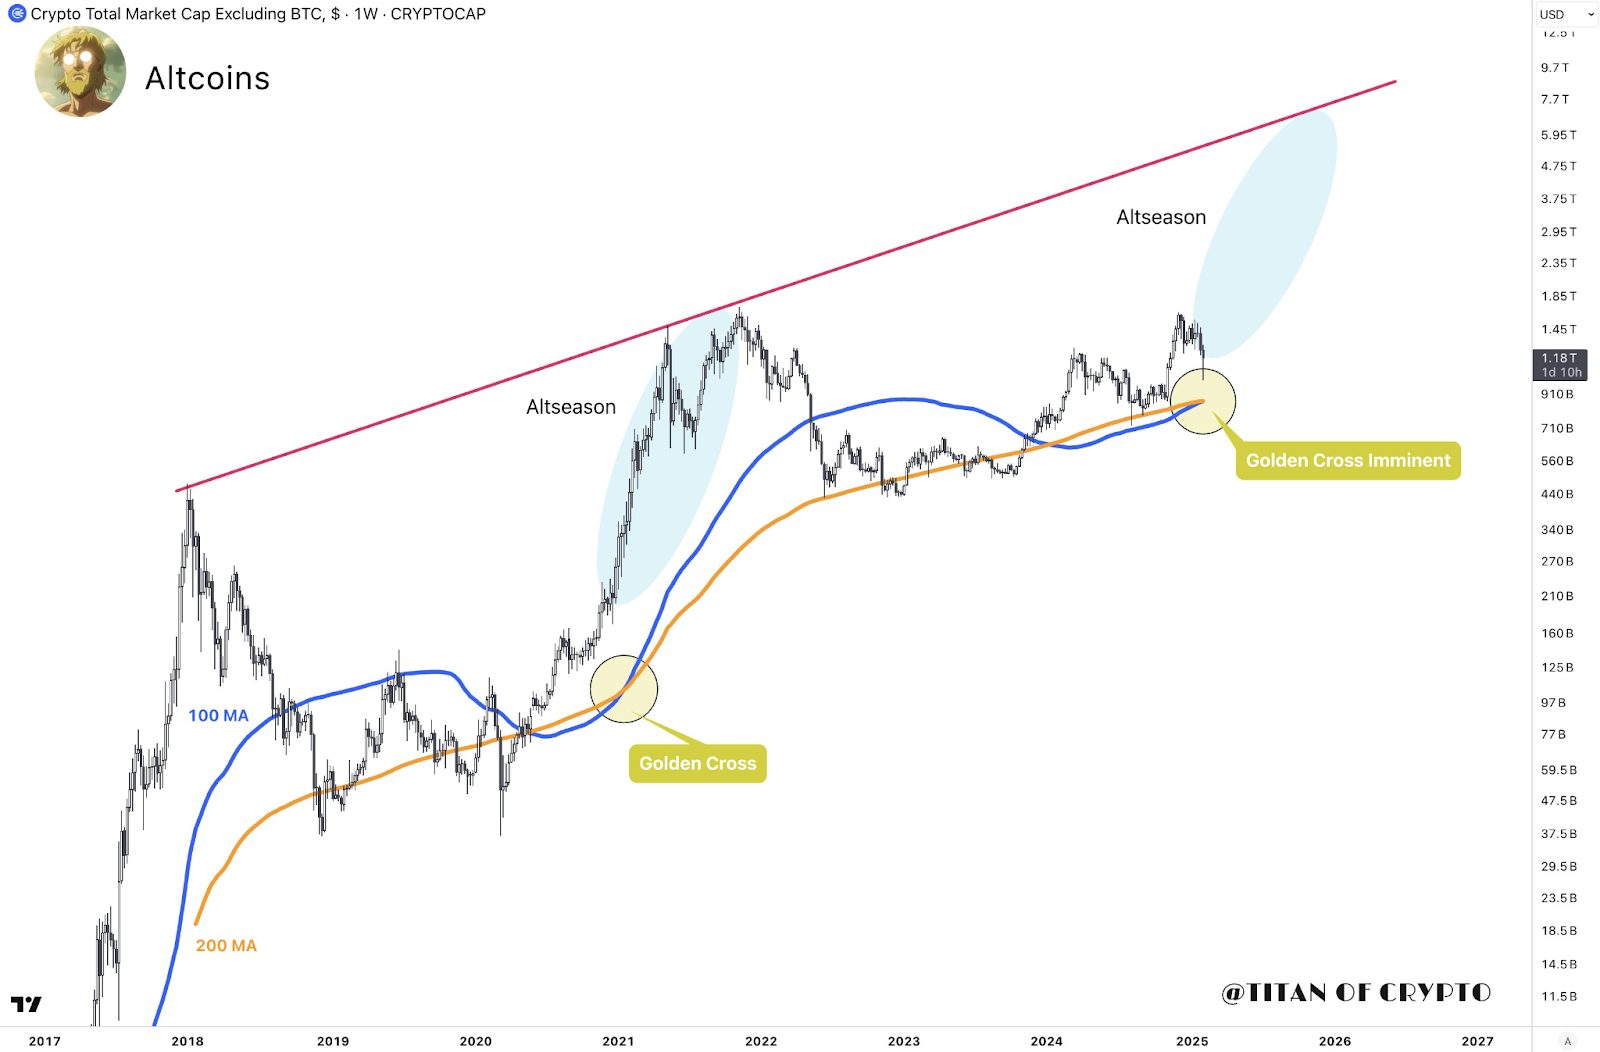
The two moving averages getting close to crossing paths. This pattern suggests another cryptocurrency cycle because it is similar to the 2020 setup. This breakout scenario is consistent with the market capitalization, which is currently $1.18 trillion.