
- USDT dominance forms a bearish descending triangle, with support at 3.80% weakening after multiple failed bounces since 2022.
- Altcoin market cap holds at $1.50T, showing bullish structure despite RSI cooling and a bearish MACD crossover indicating consolidation.
- A USDT breakdown could accelerate capital inflow into altcoins, as charts confirm steady gains and growing investor confidence.
Crypto market analyst El Crypto Prof expects altcoins to continue rising as Tether (USDT) dominance weakens and approaches a key support zone. On the weekly timeframe, USDT’s market share is exhibiting a descending triangle formation, a pattern typically associated with downward price pressure.

The chart shows a firm resistance trendline, with successive lower highs since August 2022. Peaks around 8.65% in August 2022, 7.80% in October 2022, and 6.50% in March 2025 confirm the steady decline.
Meanwhile, the horizontal support at 3.80% has been tested three times, in March 2022, March 2024, and July 2025, without a sustained bounce. As USDT dominance is at 4.28%, its downward movement is drawing increased market attention.
Breakdown Threat Grows as Support Weakens
The latest bounce near 4.28% failed to break past resistance, increasing the pressure on the 3.80% support level. Repeated tests of this level continue to weaken its strength. Chart arrows mark these rejections and failed breakouts, indicating persistent bearish control over USDT’s share.
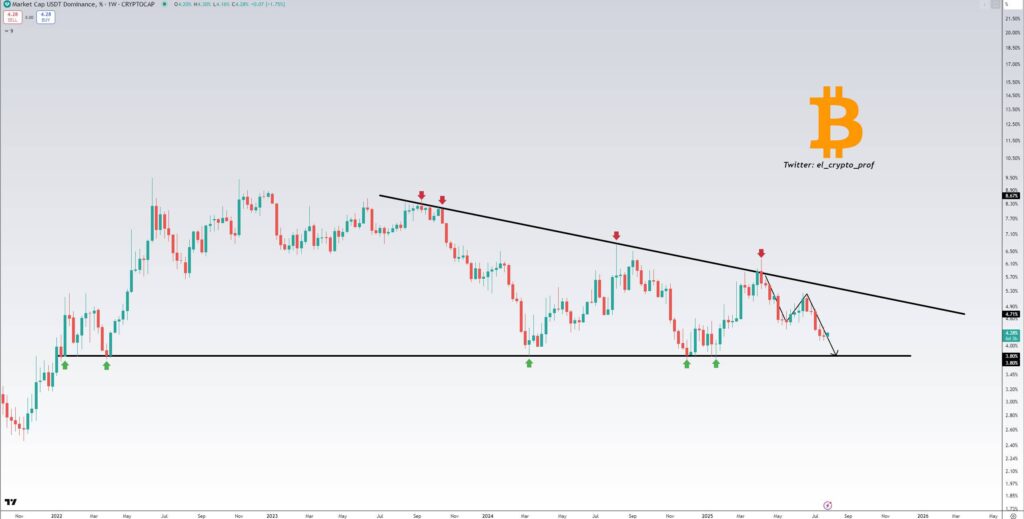
A projected move indicates a continued descent, with possible slippage below the long held 3.80% level. This technical outlook suggests reduced stablecoin preference and increasing capital movement toward volatile crypto assets.
Altcoin Market Cap Holds Steady Near Key High
The total crypto market capitalization excluding Bitcoin (TOTAL2) is strong at $1.50 trillion. This figure represents a daily gain of $20.84 billion, supported by trading volume at $252.79 billion.
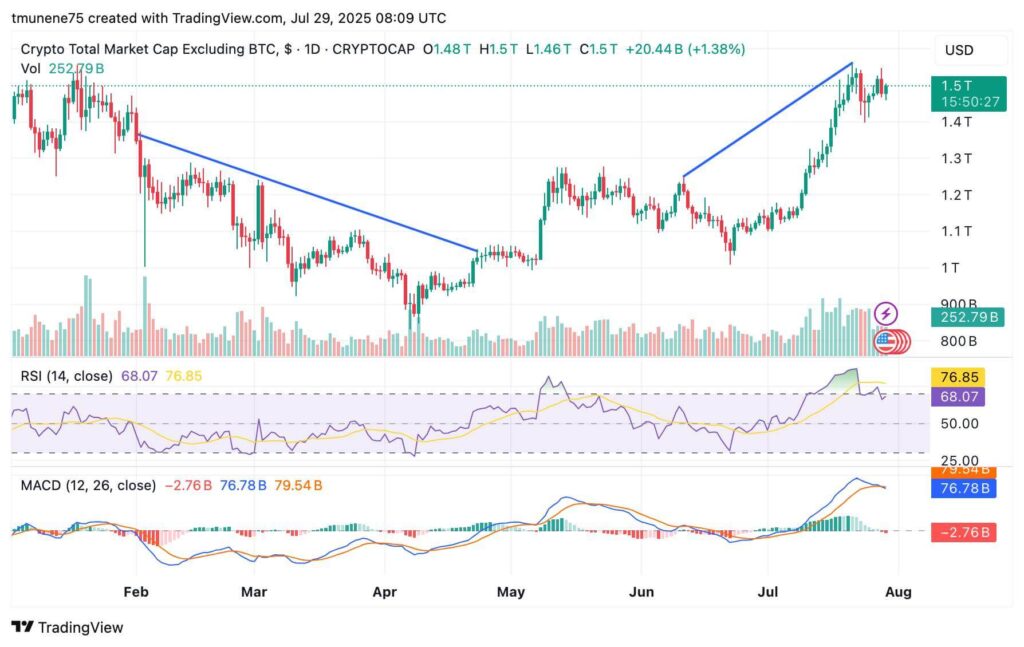
The uptrend follows a clean breakout from the downtrend that started in early February. A second ascending trendline from early July further confirms recent bullish acceleration. However, short-term indicators suggest caution may be warranted.
Momentum Slows as Indicators Show Mixed Signals
The RSI is at 68.11 after peaking at 76.85, still in bullish level but showing slight cooling. The MACD has turned negative, with the MACD line at 76.81B now below the signal line at 79.55B.
A negative histogram of -2.74B supports this shift, hinting at temporary consolidation. Despite these mixed signals, analysts are focused on the $1.45T–$1.46T zone. A bounce from this support could sustain the trend, while any drop may revisit $1.35T.