
- Altcoin market cap rebounds to $764B and eyes a potential 49% surge toward $1.15T as technicals hint at a strong breakout ahead.
- A bullish projection sees the altcoin market retesting December highs by June 2025 with steady volume and converging indicators.
- Despite recent pullbacks, the altcoin sector shows signs of reversal with rising momentum and a key pivot forming near $764B support.
The altcoin market is signaling a potential breakout following months of decline. The total market cap, excluding Bitcoin and Ethereum, currently stands at $764.62 billion. Although there’s been a minor 0.94% dip in the last 24 hours, the technical setup hints at a strong upside. The TradingView data shown by analyst Carl Moon reflects a descending channel that has shaped the market since December 2024.

Back in early December 2024, altcoins peaked at around $1.15 trillion. From there, prices entered a steady downtrend. Two parallel yellow trendlines now define the current descending channel. Since January 2025, bulls have attempted to break through the upper trendline but failed multiple times. Each attempt faced rejection, reinforcing the bearish pattern.
Key Support and Resistance Levels Forming
By early April, the altcoin market dipped to a cycle low of approximately $680 billion. However, it bounced quickly and reclaimed the $764 billion level. Currently, prices hover near the lower trendline, indicating a possible pivot point. Additionally, a red resistance line remains fixed at the $1.15 trillion level. This marks the previous local high and a major resistance zone.
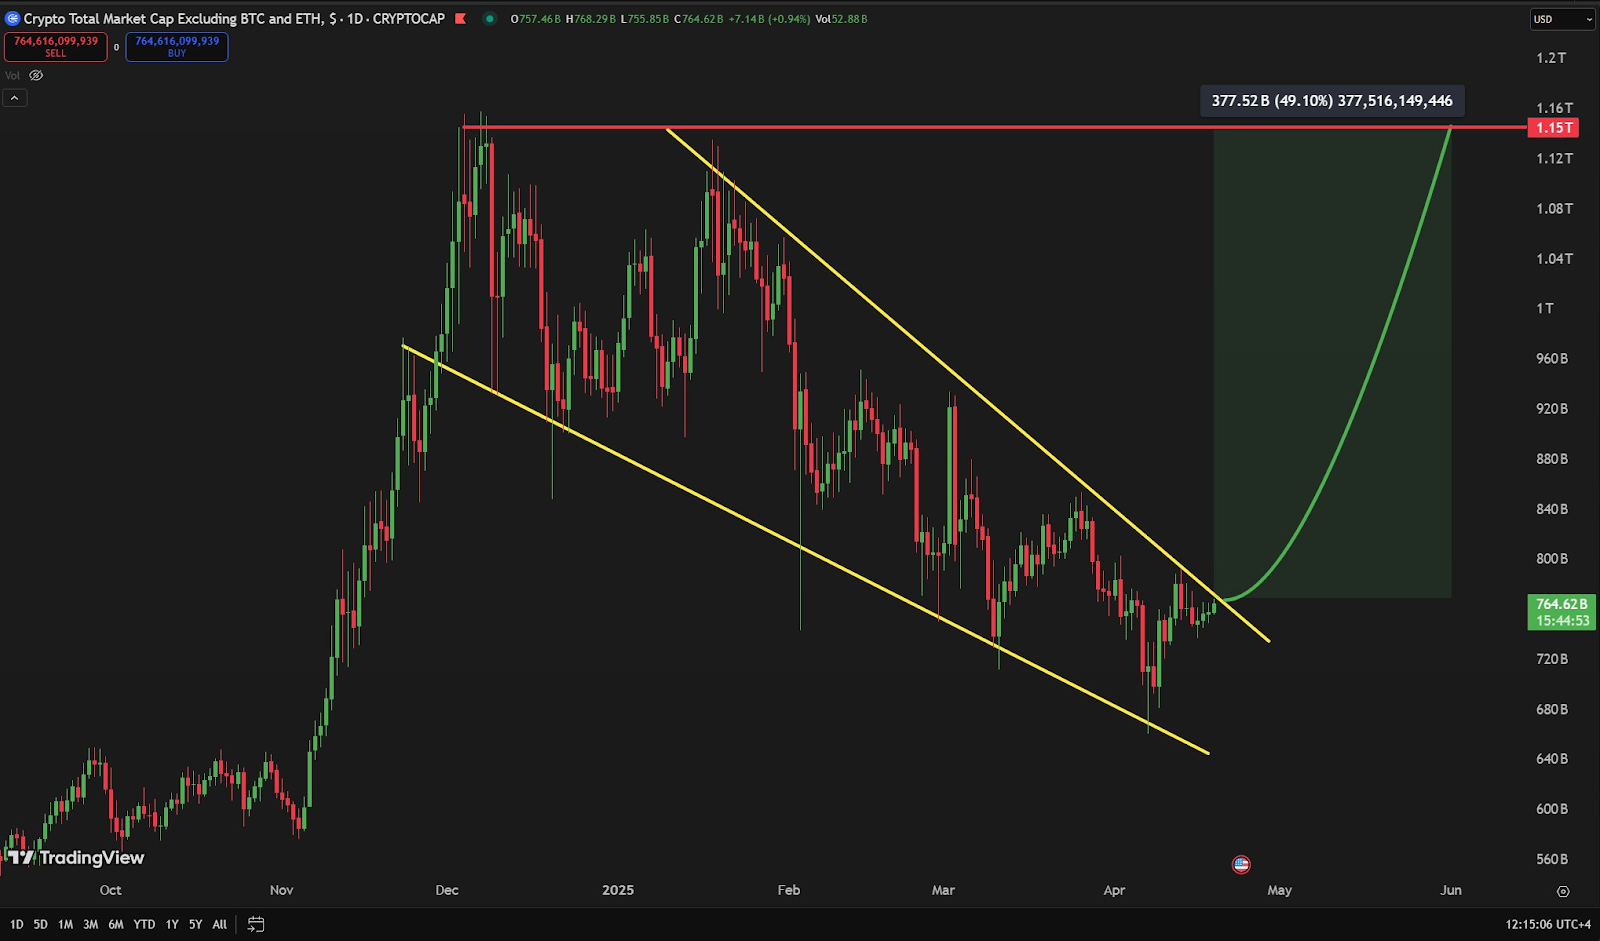
A green projection line points to a bullish retest of $1.15 trillion by June 2025. The projected move suggests a 49.1% gain from current levels. Moreover, a label shows $377.52 billion, possibly tracking a specific segment within the altcoin sector. This measurement further emphasizes the potential for sector-wide expansion.
Technical Indicators Suggest Reversal is Imminent
Volume indicators remain steady, with brief spikes during major market moves. Additionally, buy and sell volumes both stand at $764.6 billion. The data also includes multiple moving averages and other technical signals. These indicators appear to be converging, signaling a possible momentum shifth.
Consequently, the market structure is ripe for a breakout if bullish momentum holds. The green projection area, extending into June, represents a crucial window for upside movement. However, failure to break the upper trendline may continue the downtrend. Traders should watch the $800 billion level closely for confirmation.