
- Merlijn The Trader projects a $5T altcoin market cap after repeated trendline support confirms structural growth.
- CryptoRover shows an ascending triangle, targeting $1.8T–$2T if resistance at $1.1T is successfully breached.
- Sustained trading above $1T may drive liquidity into Layer-1, DeFi, AI tokens, and smaller ecosystems.
The altcoin market is showing strong technical progress after regaining key levels that previously capped growth. The market cap has moved above the $1 trillion range, a zone that repeatedly acted as resistance since 2021.
Analysts say that the latest retest of this level comes with long term support intact, increasing the possibility of sustained expansion. Historical cycles also reinforce this outlook, as previous rallies followed similar breakout points that established multi-year momentum phases.
Long Term Growth Patterns
According to analyst Merlijn The Trader, the market recently bounced off its long standing trendline, confirming continued structural strength. He noted that this pattern sets a potential move toward $5 trillion in capitalization, which aligns with the upper channel boundary.

Historical reference points support the claim, as between 2020 and 2021 altcoin values increased by nearly 500 percent. That surge carried the total from $150 billion to almost $1 trillion, highlighted in past cyclical phases.
The current chart structure shows altcoin capitalization moving once again above the $800 billion to $1 trillion resistance band. The ascending channel drawn since 2018 has contained each correction, including those in 2020, 2022, and 2024.
Each downturn was met with strong rebounds at the lower trendline, confirming the broader uptrend. Green arrows mark recent retests of support that reinforce the structural base for another expansionary phase.
Breakout Potential
CryptoRover identifies a strong ascending triangle pattern forming since the 2021 peak. He points out that the market has set higher lows, rising from $400 billion to $1 trillion across several years.
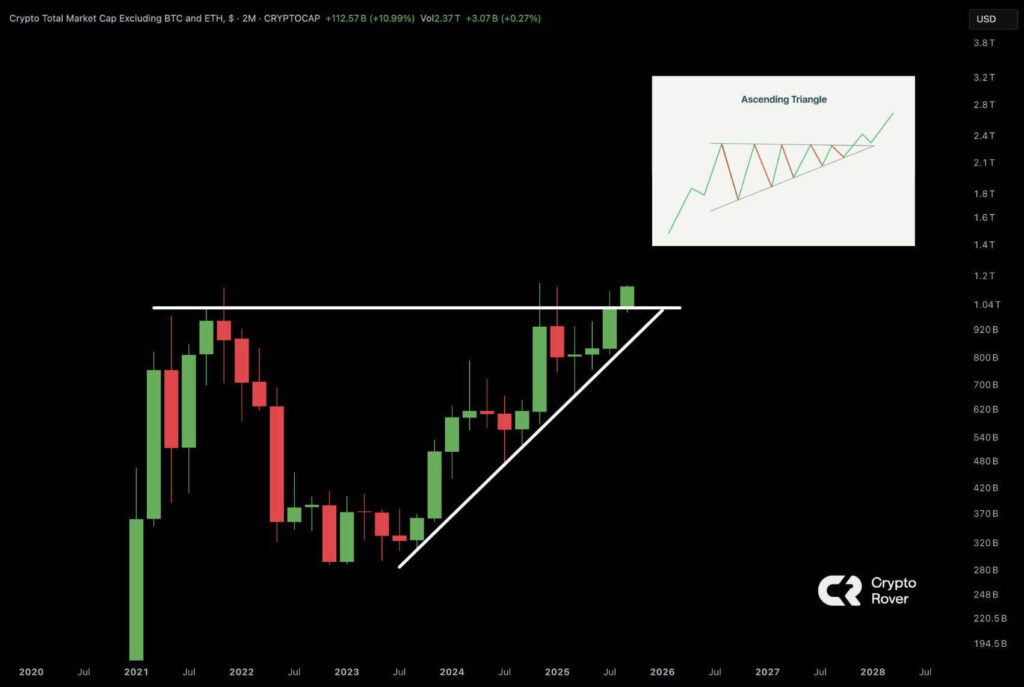
The horizontal ceiling at $1.1 trillion has blocked growth multiple times, including 2021 and again in 2025. Current prices near $1.06 trillion to $1.1 trillion are pressing against this barrier once more, creating another decisive test.
The measured move for this formation suggests a target between $1.8 trillion and $2 trillion if the breakout is sustained. This calculation adds the triangle’s approximate $700 billion height to the breakout level, producing a projected range.
However, if rejection occurs, the market could revisit support near $900 billion. Despite this possibility, the formation maintains bullish weight as long as higher lows continue holding firm.
Market Rotation and Capital Inflows
The implications of sustained breakout extend beyond price levels, suggesting broader liquidity movement across sectors. Past expansions led to strong inflows into Layer-1 platforms, decentralized finance, and newer niches like AI related tokens.
A comparable rotation would require capital changing from Bitcoin dominance, providing resources for smaller tokens. Sustained trading above the $1 trillion level is the main confirmation level, supporting both structural and cyclical bullish momentum.