
- Altcoin market cap faces resistance at $425B, but a shallower retrace hints at weakening resistance and shifting sentiment.
- Past corrections were steeper, suggesting reduced selling pressure and potential for a breakout if resistance weakens further.
- Technical patterns and Fibonacci levels indicate possible support retests before a decisive move in either direction.
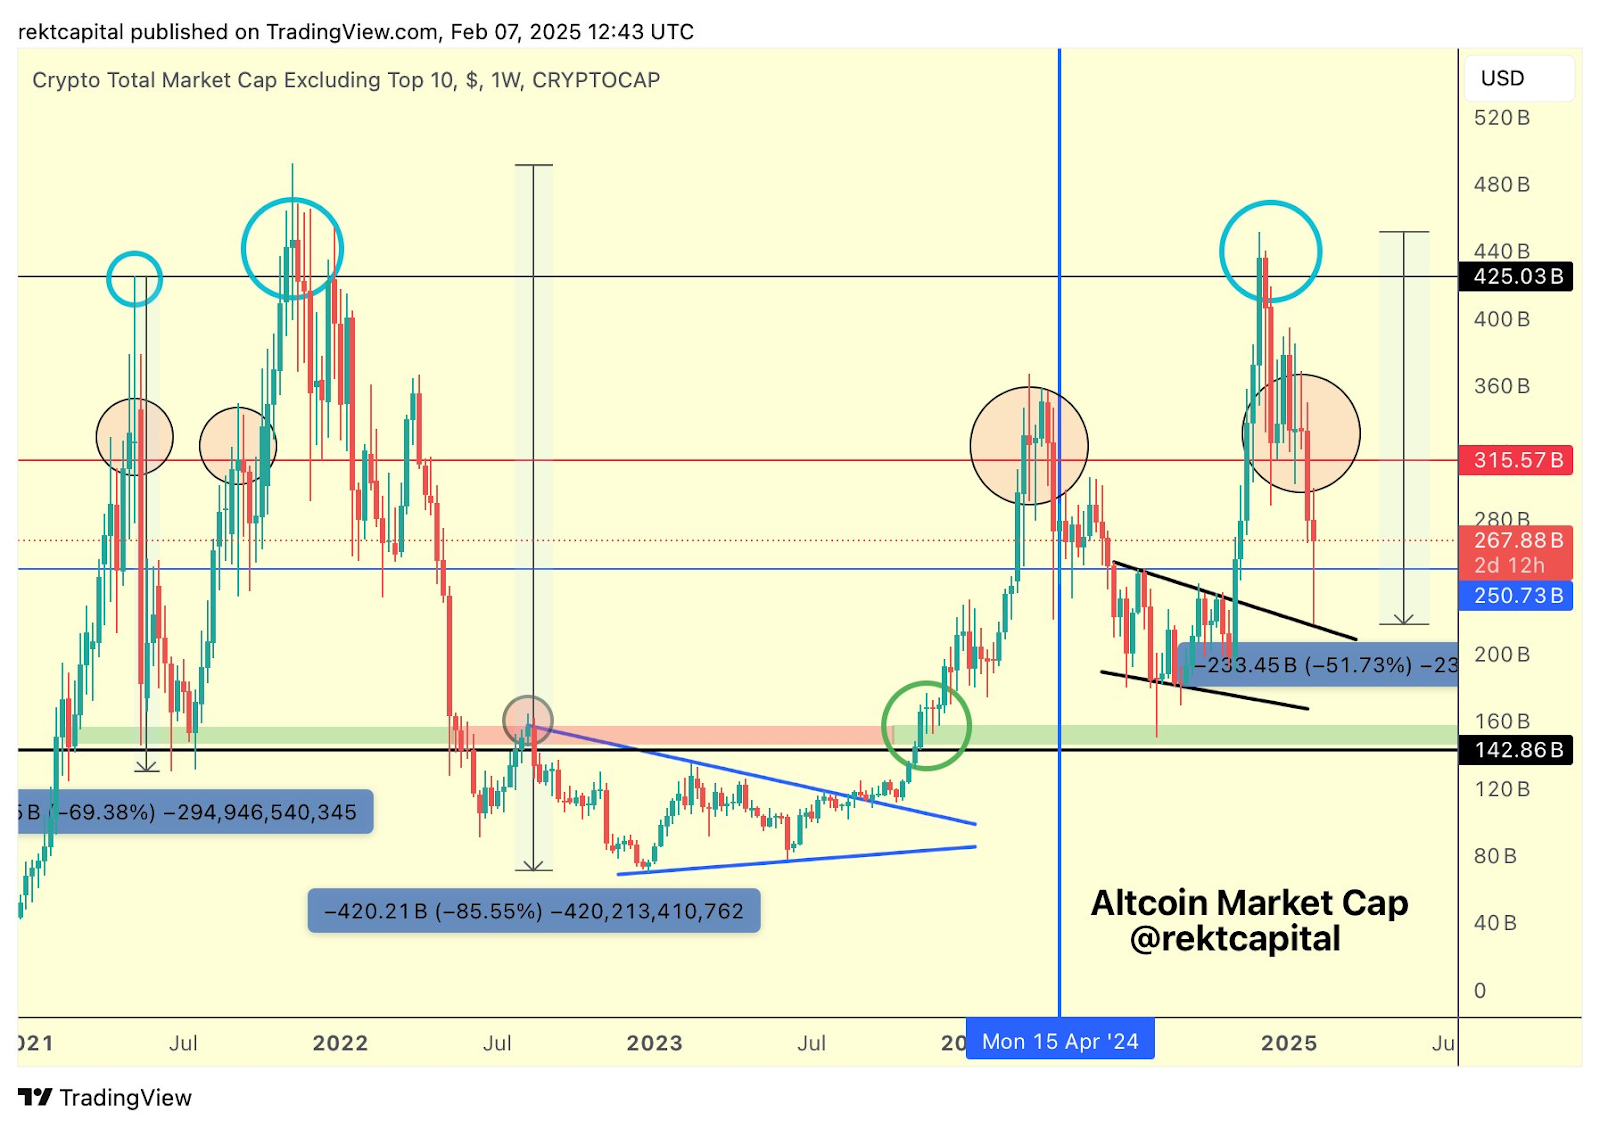
The altcoin market capitalization recently faced strong resistance at $425 billion. Despite a rejection, the retrace remains shallower than previous corrections. This signals a weakening of resistance at this level. Historically, sharp declines followed major peaks. However, the current pullback suggests a shift in market behavior. Analysts, including Rekt Capital, emphasize this as a key development in altcoin trends.
Market Cap Struggles at Resistance
Altcoin market capitalization excluding the top 10 recently peaked near $425.03 billion before a correction pushed it lower. The drop resulted in a 51.73% decline, wiping out approximately $233.45 billion. However, previous corrections were more severe, including a 69.38% drop, erasing $294.95 billion, and an 85.55% crash, reducing market value by $420.21 billion.
Compared to past cycles, the current pullback remains relatively mild. This suggests reduced selling pressure and a potential shift in investor sentiment. If the $425 billion resistance weakens further, a breakout could follow. Additionally, several support levels, including $315.57 billion, $267.88 billion, and $250.73 billion, could play crucial roles in upcoming price movements.
Technical Indicators Point to Key Market Trends
Technical patterns reveal market trends. A descending wedge preceded a breakout in early 2024, leading to a strong rally. However, the market encountered resistance near prior highs, slowing upward momentum. Historical data shows that similar rejections triggered extended corrections, aligning with horizontal resistance and support levels.
A notable date, April 15, 2024, stands out as a critical point in the trend. Multiple rejection points indicate persistent selling pressure at resistance zones. Besides, Fibonacci-based levels suggest potential retracement targets if the market continues its decline.
Downward projections indicate that capitalization may revisit lower supports before attempting another breakout. Furthermore, the shading shows bullish and bearish trends, distinguishing various market phases. If historical patterns persist, the altcoin market may see further fluctuations before establishing a clear trend.