
- Altcoin market cap faces resistance at $425B after a 51% drop, but past corrections suggest future potential recovery.
- Despite a 51% decline, altcoin market trends show cyclical recoveries, with key support around $142B for possible stabilization.
- After significant corrections, the altcoin market’s breakout above $425B remains crucial for sustained bullish momentum in 2025.
The altcoin market cap has dropped by 51% after rejecting resistance at $425 billion. This decline follows previous sharper corrections of 69% and 85% from the same level. Despite this, the current retracement remains relatively shallow compared to past declines. If the market bottoms soon, breaking past the $425 billion resistance could become easier over time.
Market Trends and Key Levels
Crypto analyst Rekt Capital illustrates altcoin market trends from 2021 to early 2025. The data reveals cyclical price movements, significant corrections, and recovery phases. In mid-2021, the C by 69.38%, erasing $294.95 billion. By mid-2022, the market bottomed out after an 85.55% crash, removing $420.21 billion in value.
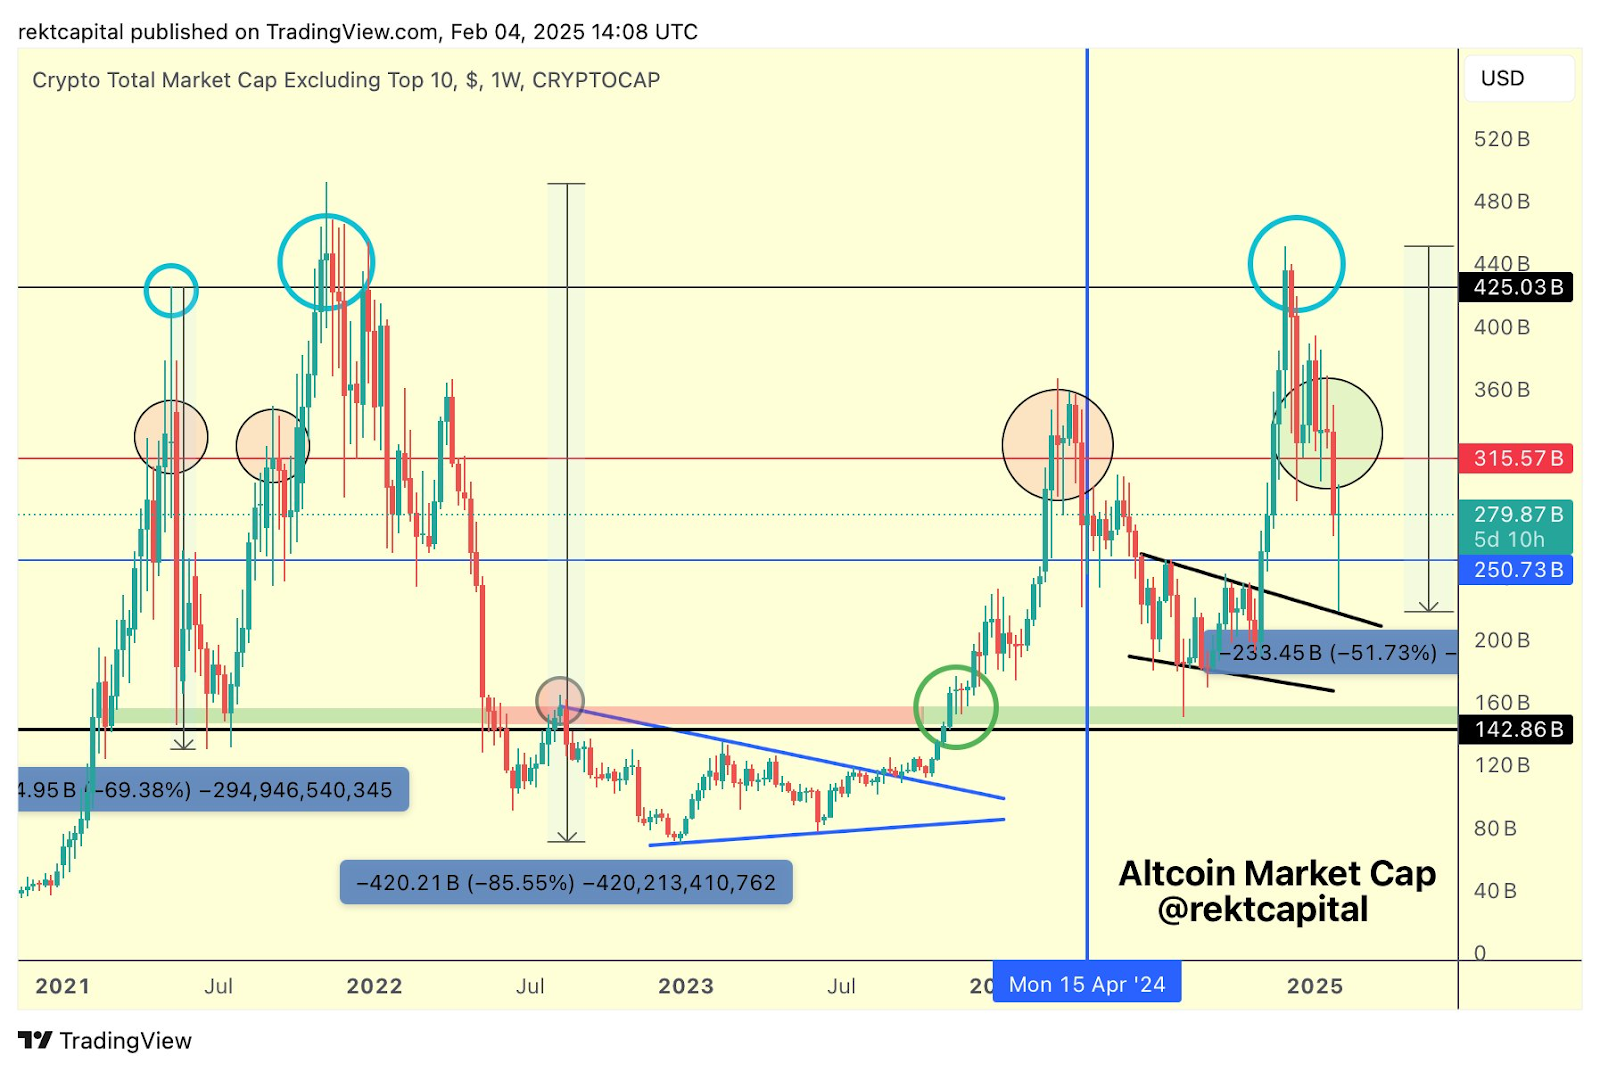
Following the steep decline, a consolidation phase formed a triangular pattern. The market eventually broke out upwards in 2023, triggering a sustained rally. By early 2024, the altcoin market cap surged past several resistance zones, reaching a peak of $425.03 billion. However, a corrective movement followed, leading to a 51.73% decline and wiping out $233.45 billion.
Support and Resistance Levels
Significantly, the market is approaching key support near $142.86 billion. Historical data indicates that this level previously acted as a major accumulation zone. Besides, intermediate resistance lies at $250.73 billion, while $315.57 billion serves as a higher resistance point.
The repetitive market cycles with major tops and bottoms are marked by circles. Blue circles signify historical peaks, while red circles denote local tops before price drops. Green circles highlight breakout points where bullish trends resumed. These patterns suggest the market follows a structured cycle of expansion, correction, and recovery.
Additionally, a descending wedge pattern emerged in late 2024, followed by a breakdown leading to further losses. This pattern typically signals potential trend reversals when confirmed with increased buying pressure.
Potential Market Movement
If the altcoin market cap stabilizes at current support, recovery could become more likely. Furthermore, past resistance at $425 billion may weaken over time, making future breakouts smoother. As April 2024 marked a major breakout, analysts will closely watch for similar signals in upcoming months.