- Altcoin market breaks downtrend as broadening wedge signals potential for major upside.
- Bullish MACD cross and inverse head & shoulders pattern hint at $1.29T altcoin target.
- Ethereum activity spikes, Solana rallies, and falling BTC dominance suggests altcoin rotation.
The altcoin market is showing renewed strength as multiple indicators confirm a shift in momentum. A clear break in the downtrend, a bullish MACD crossover, and chart structures seen in previous altcoin rallies are aligning once again. Analysts suggest history may be setting the stage for another strong upward cycle.
Technical Setup Points to Breakout Potential
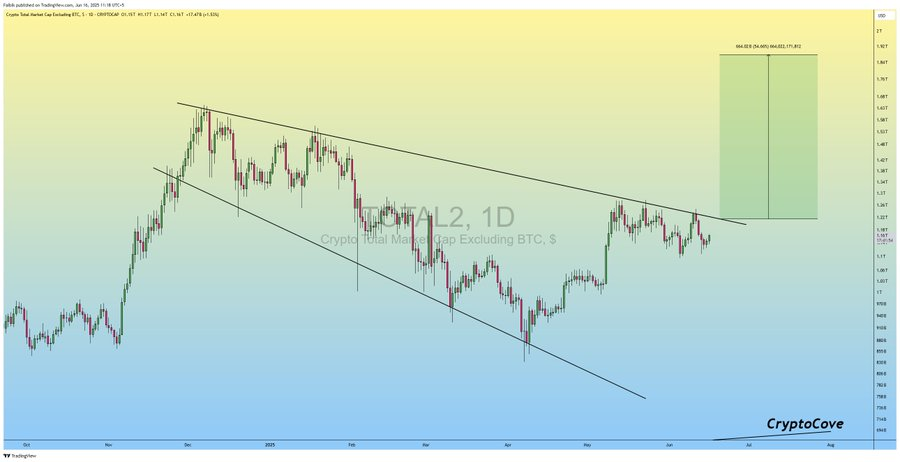
According to an analysis prepared by Captain Faibik, the altcoin market is approaching a breakout from a broadening wedge pattern. This chart formation is usually associated with price expansion and volatility. A breakout from this structure could signal the beginning of a steep upward move in the market.
The same observation has been supported by Merlijn The Trader, who confirmed that the market has broken its previous downtrend and that the MACD has formed a bullish cross. “This structure doesn’t lie,” he stated on social platform X. According to the expert, past breakouts with the same setup led to vertical rallies across many altcoins.
Trader Tardigrade also analyzed the TOTAL3 chart, which tracks the market cap of altcoins excluding Bitcoin and Ethereum. He reported the formation of an Inverse Head and Shoulders pattern, with the neckline resistance marked at $920 billion. A breakout above this level could push the market towards a target of $1.29 trillion.
Market Sentiment and On-Chain Activity Rising
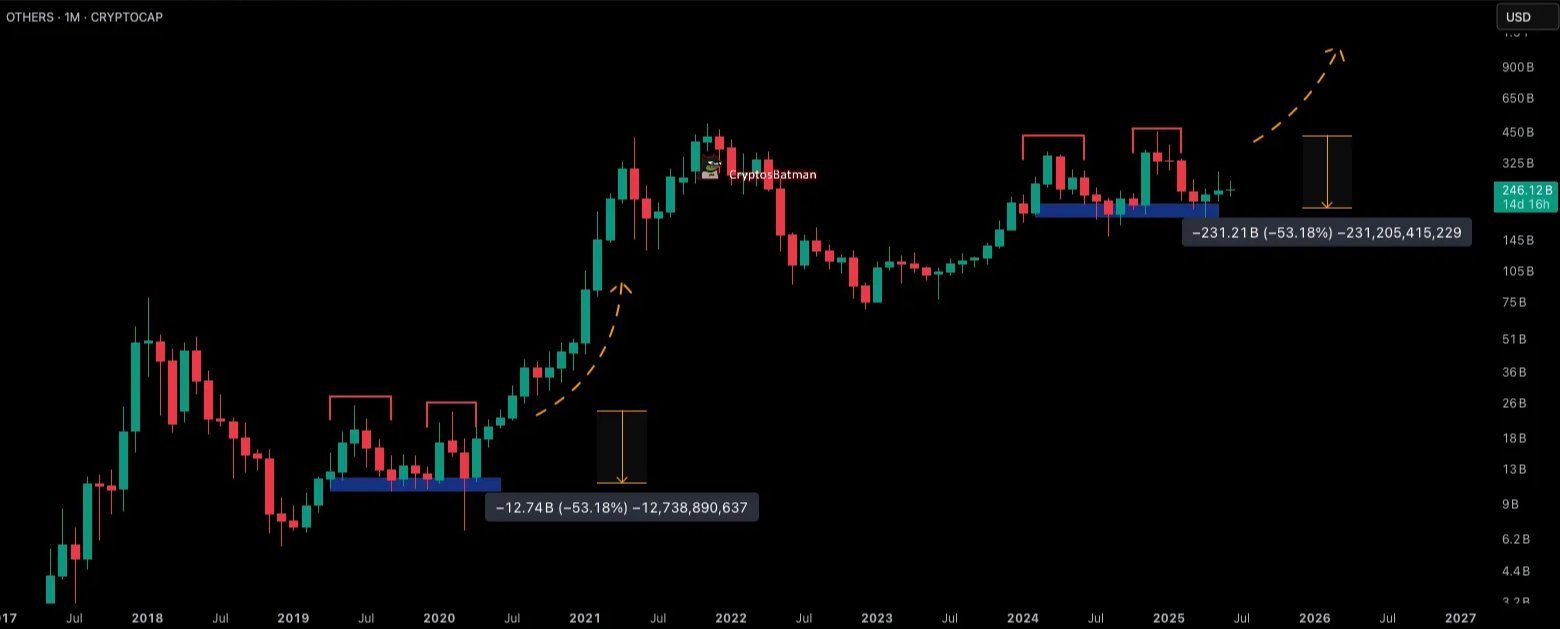
Crypto analyst BATMAN observed that current price movements resemble the patterns seen before the 2020-2021 altcoin rally. On the weekly chart, a similar decline of 53% has occurred from the second top to current support, reflecting a pattern from previous market cycles.
Ethereum and Solana have shown strong momentum, with ETH up 8.2% and SOL climbing 12.4% on June 17, 2025. Ethereum’s MACD also confirmed a bullish crossover while SOL’s RSI approached 68 on the 4-hour chart, indicating strong demand.
According to Glassnode, Ethereum’s daily active addresses rose by 15% to 1.2 million. Bitcoin dominance has dropped to 53.8%, often seen as a sign that capital is flowing into altcoins.