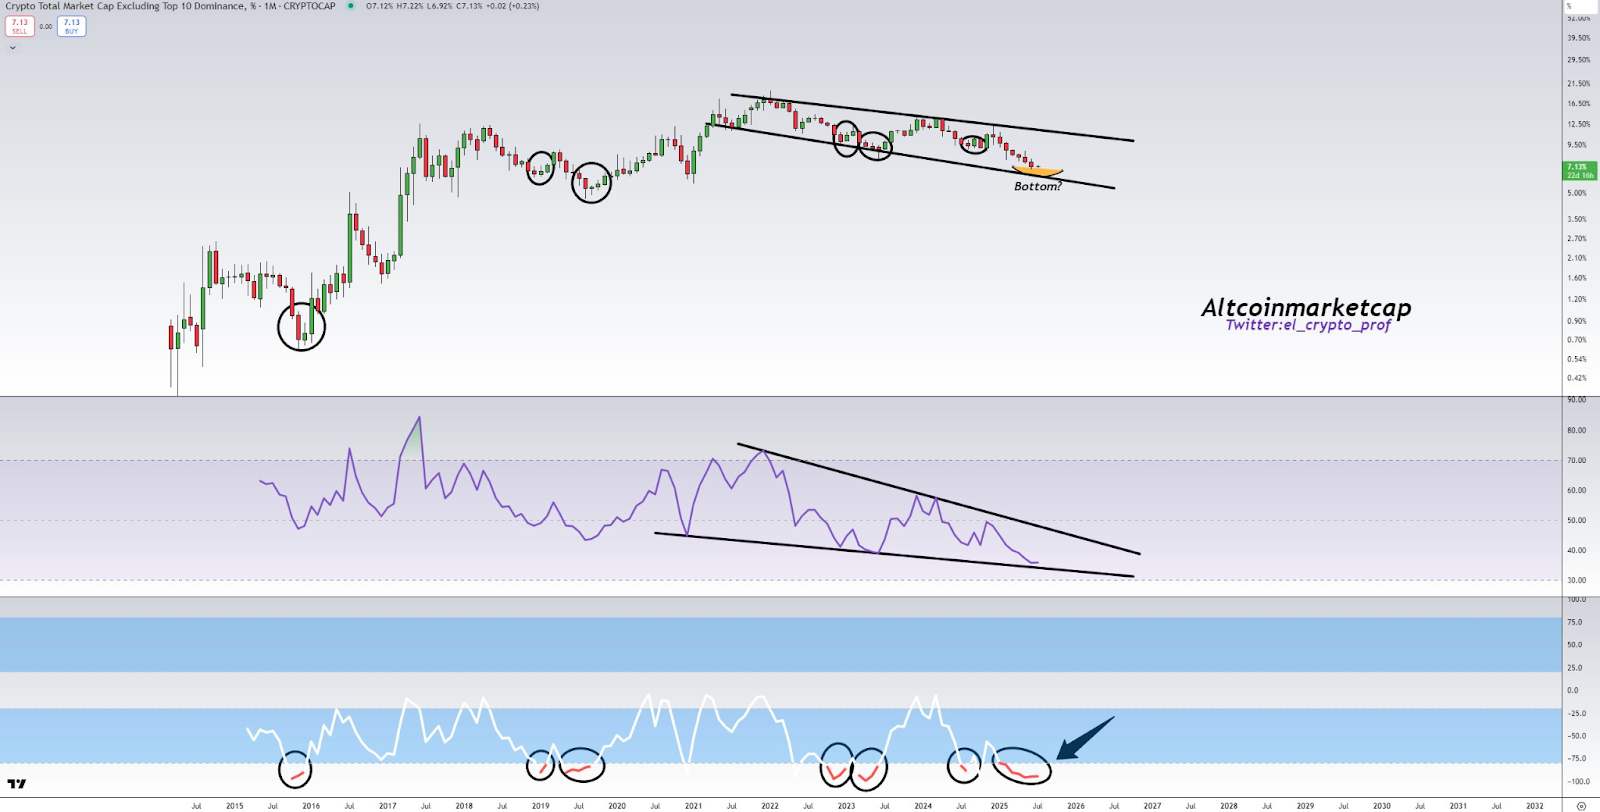
- Altcoin dominance forms a multi-year descending channel with signs of bottoming near 7.00% support.
- RSI shows a five-year falling wedge pattern nearing breakout, signaling rising momentum across altcoins.
- Stochastic oscillator mirrors 2016 and 2019 cycle lows, historically followed by powerful altcoin rallies.
Altcoin dominance excluding the top 10 coins, are at historically low levels. As of July 2025, its market share stands at 7.13%, down from a peak near 17%. This extended decline has lasted longer than any correction in the past decade. However, recent technical patterns now point toward a possible breakout.

Technical Setup Mirrors Previous Bottoms
The chart structure reveals a descending channel forming since early 2022. This pattern marks consistent lower highs and lower lows. Candle formations have repeatedly tested the lower channel boundary, forming rounded bases. Notably, these formations appear at key historical support zones. A horizontal trendline around 7.00% indicates a possible base is now forming.
Source: Decode
Additionally, the RSI indicator shows a nearly five-year falling wedge. RSI values have reached deeply oversold levels. This wedge pattern has compressed into a tight range, approaching a breakout zone. Since early 2022, the lower wedge support has held firmly. Previous RSI wedge compressions in 2016 and 2020 preceded large price surges.
Moreover, the stochastic momentum oscillator is showing a rounded bottom near -75. These patterns have historically aligned with powerful bullish reversals. Marked cycles in 2016, 2019, and 2023 all followed this oscillator setup. This current structure aligns tightly with those earlier events.
Market Cycles Show Strong Repetition
Besides structural signals, market cycles also repeat. Each historical oscillator low came after prolonged corrections, followed by major upside moves. The chart reveals repeated price behavior, supported by matching RSI and oscillator patterns. Candle structures now mimic those seen before earlier breakouts in dominance.
Source: moustache
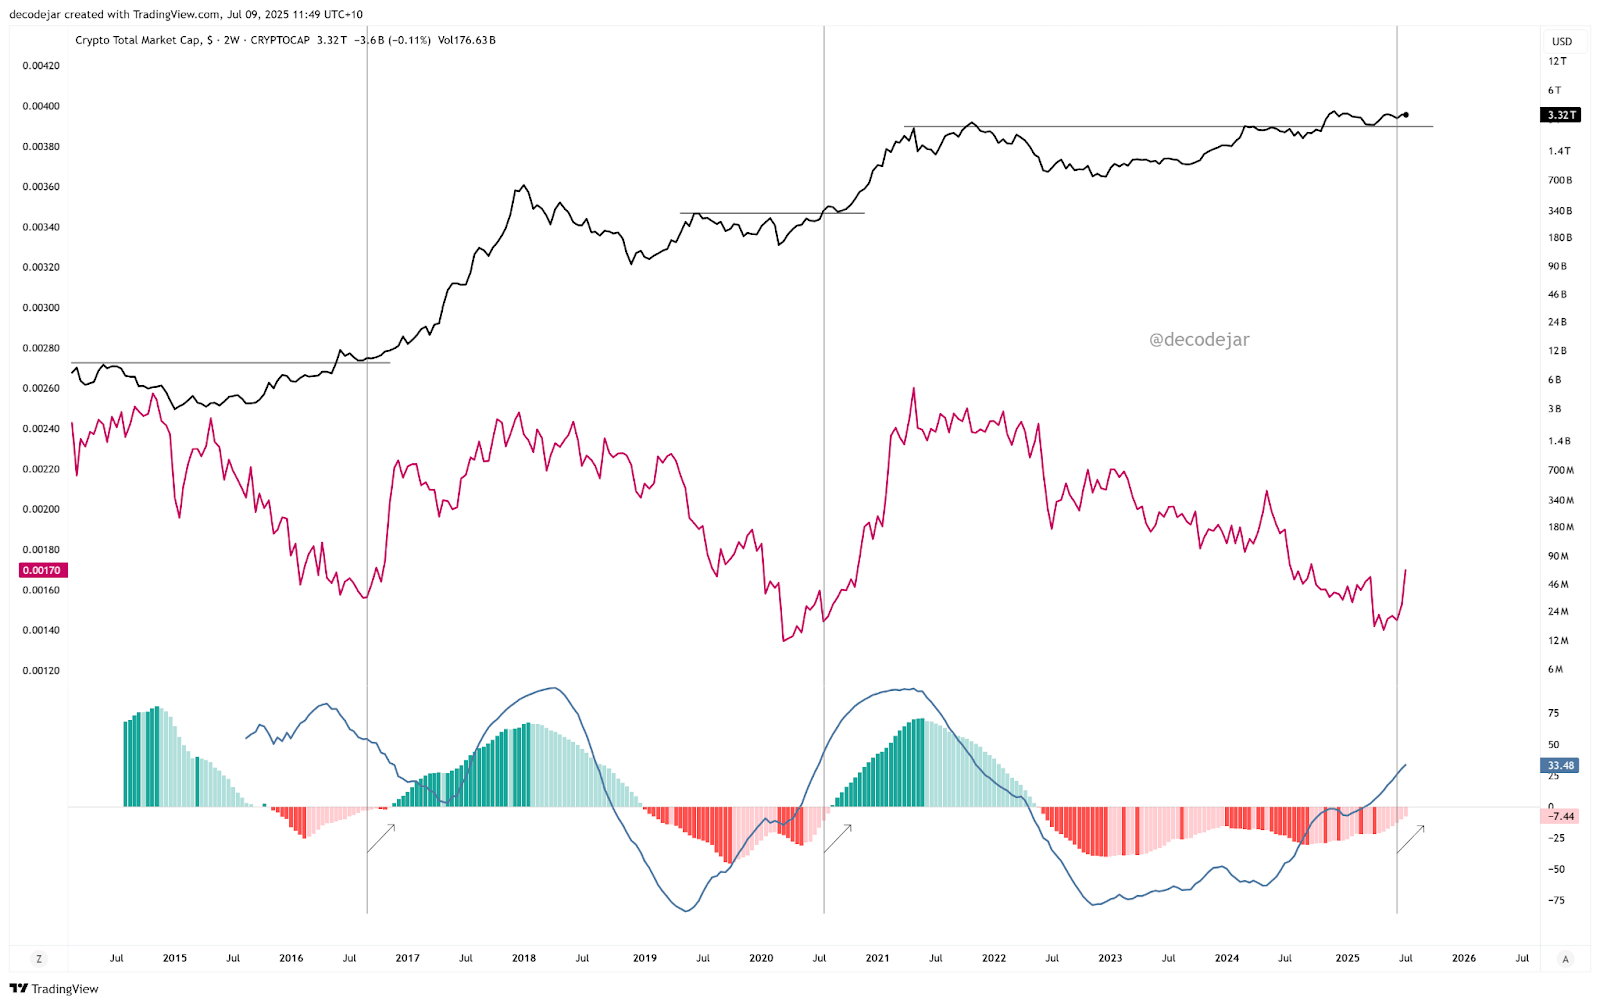
Consequently, the entire setup signals another potential rotation into altcoins. Bitcoin dominance also appears to be reversing slightly. Meanwhile, the crypto market cap has broken past consolidation zones. It currently stabilizes above $3.27 trillion, reflecting renewed strength.