
- Alphabet ($GOOG) eyes rebound as TD Sequential signals potential trend exhaustion near key support at $166.32.
- Stabilization near the 325-day SMA may support a bullish shift, though resistance looms around $176–$180.
- Declining volume suggests easing selling pressure, but a break above resistance is crucial for a confirmed reversal.
Alphabet Inc. may be positioning for a potential rebound as critical technical indicators suggest a pause in the ongoing downtrend according to analyst Ali. The TD Sequential indicator recently flashed a buy signal on the 3-day chart, hinting at a possible reversal.
The stock has shown a consistent downward trajectory, with the latest 3-day candlestick reflecting selling pressure. Alphabet opened at $166.68 and closed at $165.98, marking a 1.09% decline. The high was $168.66, and the low dropped down to $163.24.
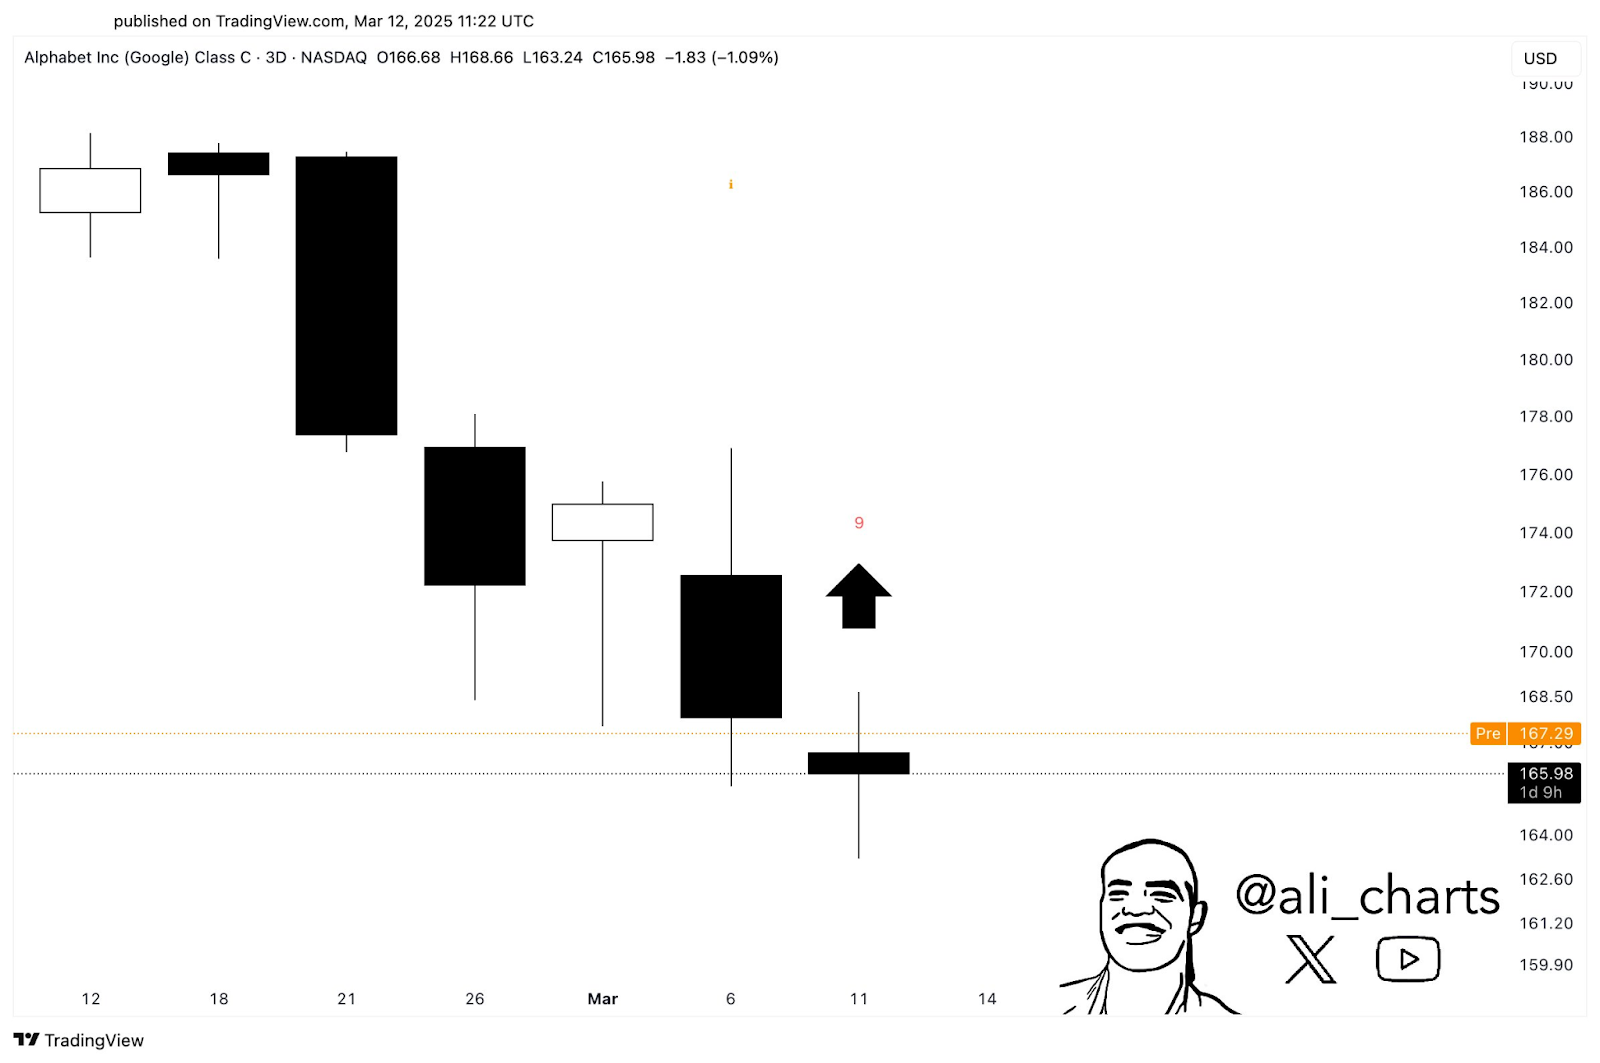
Noticeably, a “9” had previously formed before the final candlestick, typically seen as a signal of trend exhaustion. This came together with being close to a very important level of support, suggesting an impending reversal.
Furthermore, the chart displays an upward black arrow, possibly indicating expectations of a bullish move. Pre-market data shows a slight uptick, with prices reaching $167.29. This stabilization near support levels could be pivotal. If buying pressure strengthens, the price may rebound from this support zone.
Key Moving Averages and Support Levels
Besides the TD Sequential indicator, moving averages offer crucial insights. Jo Trader highlighted the significance of the 325-day Simple Moving Average (SMA), currently at $166.32. The stock’s daily movement indicates a 0.85% increase, with an initial price of $168.47, a high of $169.30, and a closing price of $167.39.
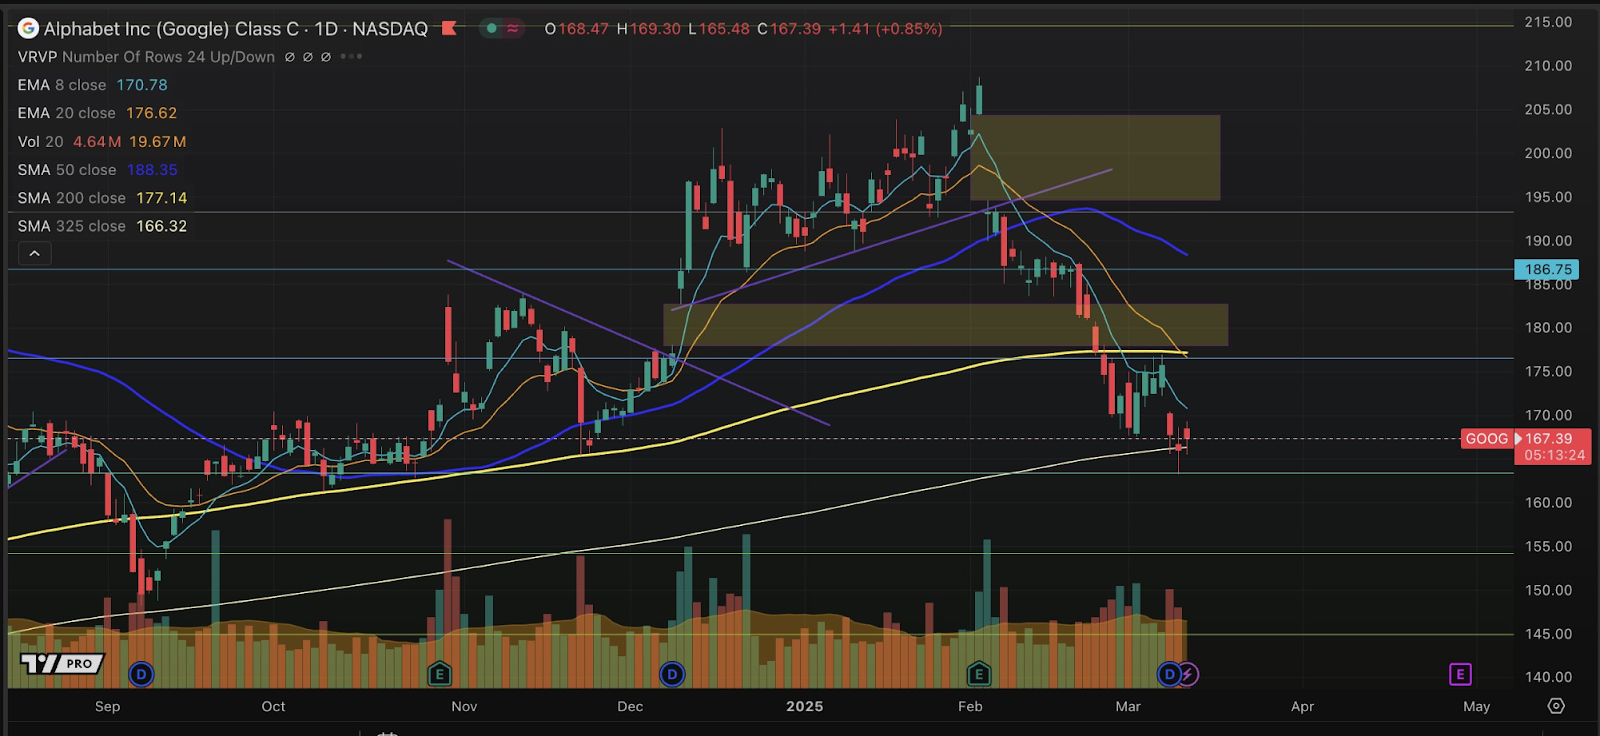
The price is still below the 50-day SMA ($188.35), 20-day EMA ($176.62), and 8-day EMA ($170.78), nevertheless. Additionally, the price has dropped below the 200-day SMA ($177.14), suggesting a negative. Yet, it still hovers just above the 325-day SMA. This level is acting as immediate support and could stabilize the price in the short term.
Resistance Zones and Market Sentiment
Volume analysis reveals a recent trading volume of 4.64 million shares, notably lower than the average of 19.67 million. This decline suggests weakening selling pressure. Key resistance zones exist around $176 to $180, aligning with the 20-day EMA. Another significant resistance is near $200, where past price rejections occurred.
For a confirmed bullish reversal, Alphabet must break above these resistance levels. Until then, cautious optimism prevails. The interplay between support and resistance will shape the stock’s near-term trajectory.