
- The buying momentum for ACT/USDT continues to rise as both MACD and RSI signal upcoming price growth.
- A breakout above $0.25 could trigger a rally towards $0.38 – $0.40 in the short term.
- Market confidence and accumulation activities stem from ACT’s bullish trend based on its price volatility and elevated purchase price point.
Act I The AI Prophecy (ACT) is a cryptocurrency gaining traction, showing strong volatility and bullish momentum in recent market trends. Currently,the Act I The AI Prophecy (ACT) shows a current price of $0.2176, reflecting a 16.4% increase in the last 24 hours. The price of BTC stands at 0.0002453 BTC demonstrating a strong upward trend with a 16.7% growth over Bitcoin pair. The market shows significant price volatility with a trading range from $0.1869 to $0.2362 across the 24-hour period.
The strong upward movement suggests increased demand, likely driven by positive sentiment, or technical breakouts. Continued bullish momentum could propel ACT above $0.2362 as the price targets $0.25 to $0.27 in the coming months.
ACT Tests Key Resistance: Breakout Could Signal Bullish Rally
The ACT/USDT chart on the 8-hour timeframe shows a significant price movement testing a descending trendline resistance, which has been a key barrier since the previous peak.The market price remains in a significant resistance area between $0.23 – $0.25, an area that previously acted as support and is now a major hurdle for further upside movement.
A significant price rise above $0.25 combined with increased trading volume would initiate a short-term upward trend toward $0.38 – $0.40.Overall, the market sentiment hinges on whether ACT can decisively break the $0.25 barrier.
The 1 Hour ACT/USDT Pair Shows Bullish Momentum
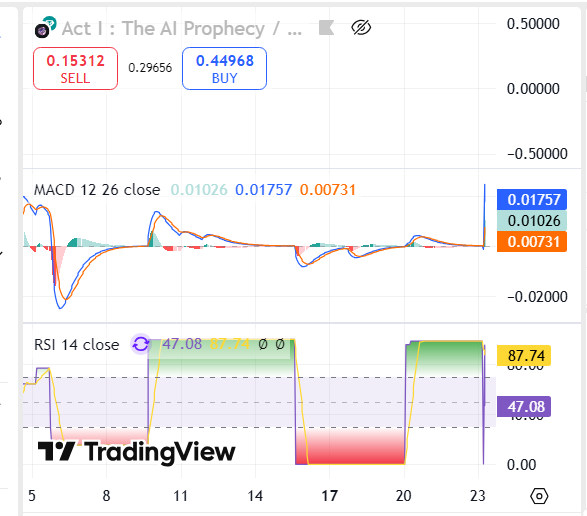
The AI Prophecy (ACT/USDT) indicates growing bullish momentum with the MACD line (0.01757) moving above the signal line (0.00731) and a positive histogram (0.01026), signaling increasing buying pressure. Additionally, the RSI level now stands at 47.08 while attaining recovery status after reaching an overbought position at 87.74.
If the RSI moves above the neutral 50 point it will confirm renewed strength. The price gap between the buy price of 0.44968 and the sell price of 0.15312 demonstrates both volatility and potential accumulation activity. ACT would signal bullish outlooks through higher resistance tests if buying pressure keeps increasing.