
- JASMY’s current price is $0.03157, just below the $0.03200 resistance level, indicating a potential short-term barrier.
- Support level around $0.02550 has been tested twice, showing strong buying interest at this price point.
- Recent price movement shows volatility with a peak at $0.032 and stabilization, suggesting possible consolidation.
JasmyCoin (JASMY) has recently exhibited signs of a potential recovery against the US Dollar (USD). On July 28, 2024, the latest data from Coinbase shows a daily candlestick chart indicating notable movements in JASMY’s price.

Overview of Price Movements
The daily candlestick chart shows JASMY’s price fluctuating between approximately $0.01840 and $0.04600, with a current price of $0.03157. The recent trend highlights a recovery from mid-July lows, showing an upward movement towards the current level.
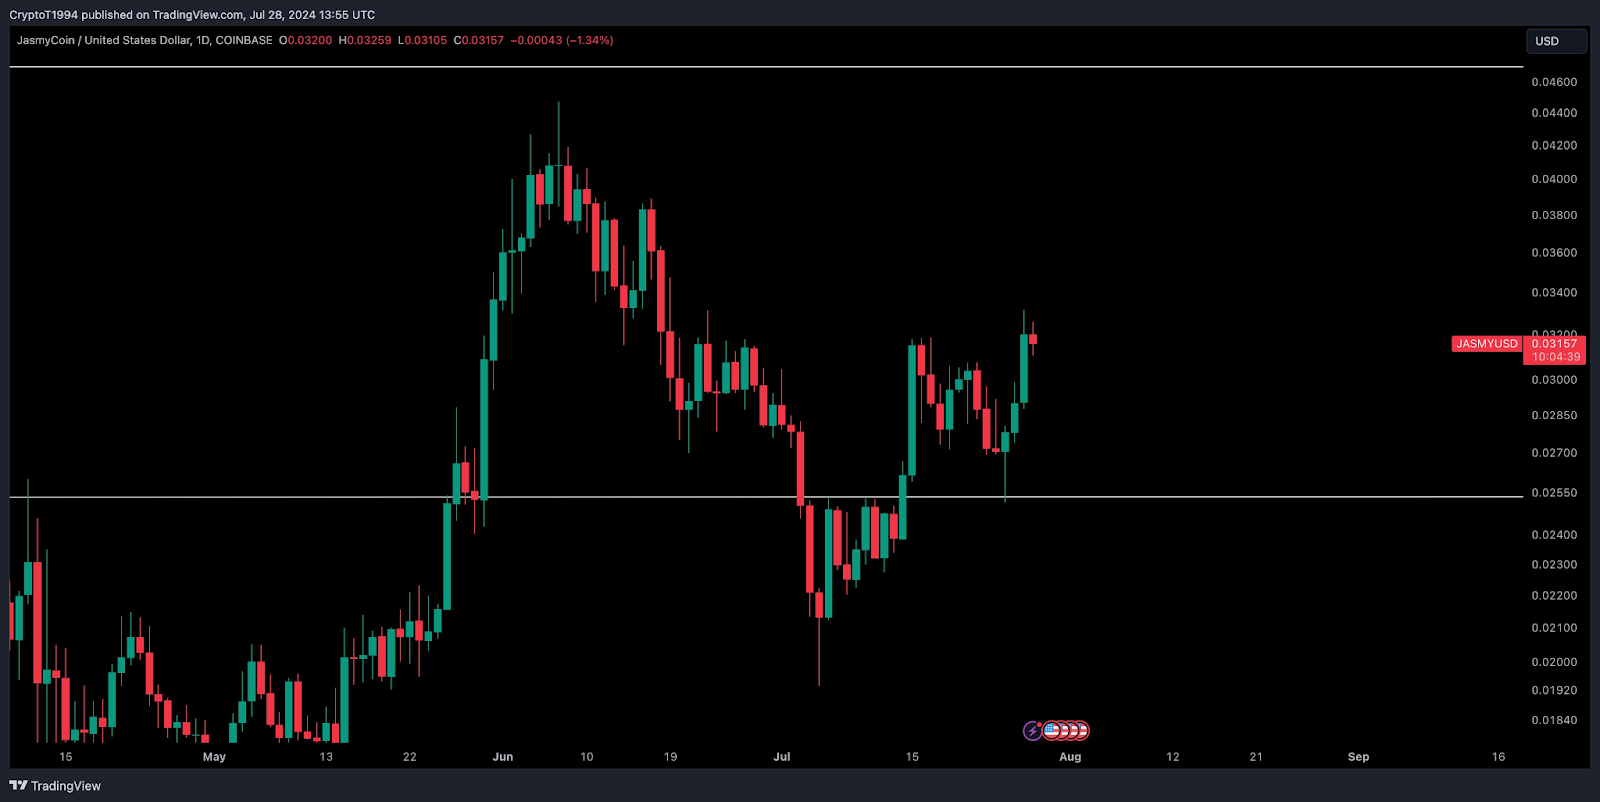
Source: Crypto Tony on X
The support level is around $0.02550, which has been tested twice recently, indicating strong buying interest at this price. On the other hand, the resistance level is approximately $0.03200. The current price is just below this resistance, suggesting it might act as a barrier in the short term.
Candlestick Patterns and Recent Trends
Recent candlesticks indicate a bullish trend, with a series of green candles showing upward momentum. However, the latest red candle suggests a minor pullback, pointing to a possible short-term retracement.
In mid-June, JASMY reached a peak of approximately $0.04600, followed by a downward trend to around $0.02200 in mid-July. The recent uptrend shows a recovery from these lows.
Potential Analysis and Trading Strategies
For traders considering JASMY, both bullish and bearish perspectives are possible. If JASMY breaks above the $0.03200 resistance, it could continue its upward trend, with traders potentially targeting the previous high near $0.04600.
Conversely, if JASMY fails to surpass the $0.03200 resistance and reverses, it might test the support level around $0.02550. A break below this support could indicate further downside potential.
Recent 7-Day Price Movement
Over the past week, JASMY’s price movement has shown volatility. Starting at around $0.02924 on July 23, the price dropped to approximately $0.026 on July 25, indicating a bearish sentiment or negative news.
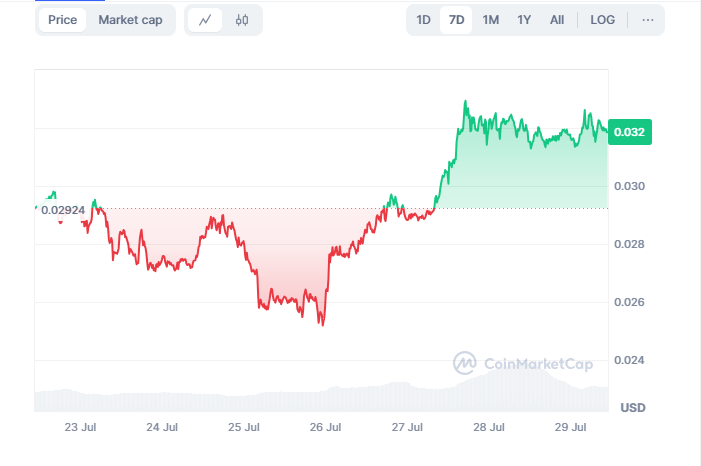
Source; CoinMarketCap
It then recovered and peaked at around $0.032 between July 27 and 28, suggesting a bullish sentiment possibly due to positive news or increased buying interest. By July 29, the price stabilized at $0.032, at press time, hinting at a consolidation phase.
JasmyCoin’s recent movements against the USD suggest potential for both upward and downward trends. The market should watch for a break above the $0.03200 resistance or a reversal towards the support level for a better insight into JASMY’s next move. As always, using additional technical indicators and broader market analysis can help make informed decisions.