
- JasmyCoin projects a potential price target of $0.30821, indicating an upside from its current $0.0324 price.
- Two cup-and-handle patterns signal bullish momentum, with strong volume and RSI at 65.12 suggesting further upward movement.
- JasmyCoin’s MACD supports a bullish outlook, with potential for further growth towards $0.5822, according to trend analysis.
JasmyCoin (JASMY) is gaining attention with its remarkable price movement and bullish indicators. Currently trading around $0.0324, JasmyCoin has shown growth over the past months.

Ascending Trends and Bullish Patterns
A detailed examination of the recent price action reveals a persistent upward trend, underpinned by an ascending support line. Notably, JasmyCoin has formed two significant cup-and-handle patterns.
The first pattern completed in March 2024, while the second one is still unfolding. These patterns typically signal a continuation of bullish momentum, with price targets projected based on the height of the cups.
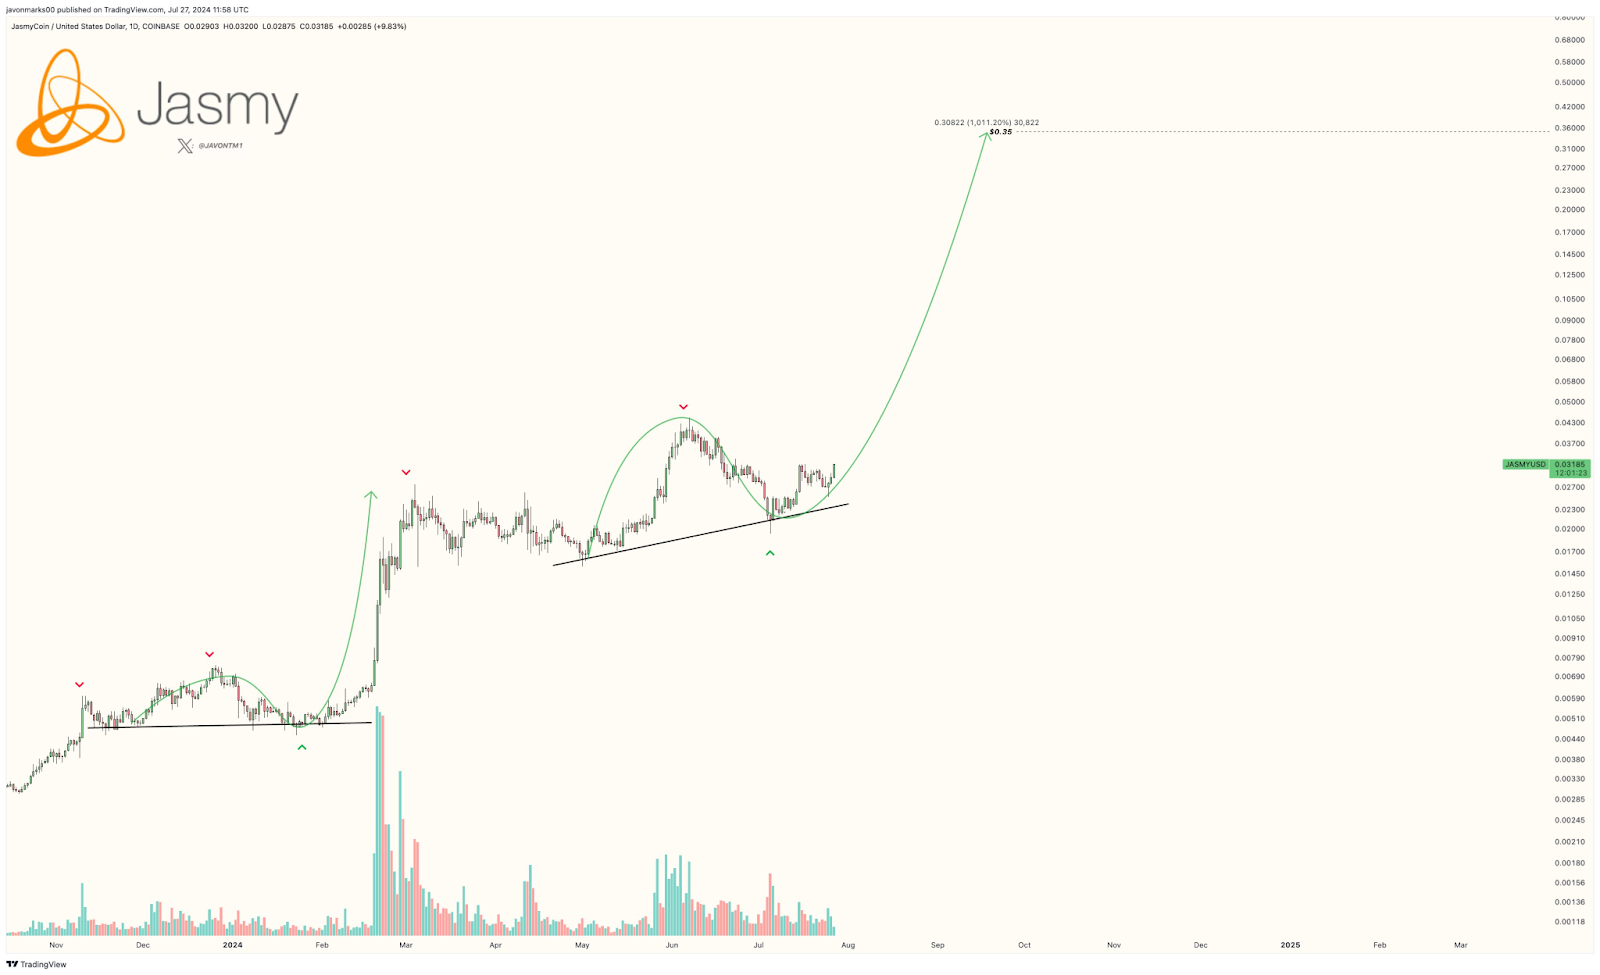
Source; JAVON MARKS on X
For JasmyCoin, the projected price target stands at $0.30821. This estimation is derived from the cup pattern’s height, projected upwards from the handle’s breakout point. This target suggests a substantial potential upside from the current trading price, highlighting the cryptocurrency’s bullish outlook.
Volume and Momentum Indicators
Volume analysis supports the bullish trend, with notable spikes during upward movements. Increased trading volume during price surges indicates strong buying interest, reinforcing the validity of the bullish patterns. The current price of $0.03234 reflects an increase from the recent low of around $0.02700, suggesting continued upward momentum.
Examining the RSI (Relative Strength Index), currently at 65.12, indicates that JasmyCoin is nearing overbought territory but not quite there yet. This level suggests further upward movement is possible before a correction.
The MACD (Moving Average Convergence Divergence) also supports this outlook, with a positive histogram and the MACD line nearing a bullish crossover above the signal line.
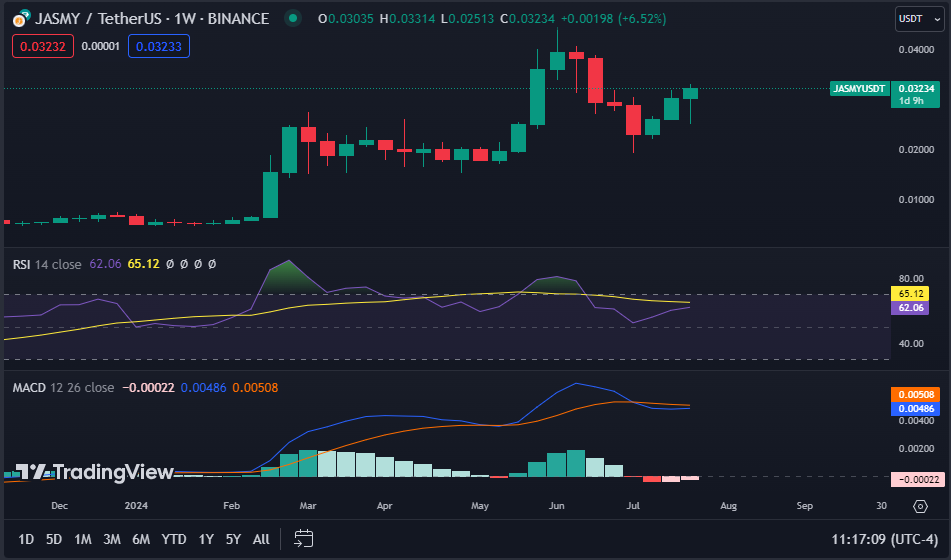
Source; TradingView
Support, Resistance, and Future Projections
The price chart shows notable support and resistance levels. The ascending trend line offers major support, while resistance levels, marked by red arrows, could pose challenges. The weekly chart further substantiates this analysis, with the current price reflecting a 6.52% increase over the past week.
The chart includes a price projection line extending to $0.5822, suggesting potential for further growth. However, traders should monitor the RSI and MACD indicators closely. If the RSI crosses into overbought territory or the MACD line crosses above the signal line, it would further confirm the bullish trend.
At press time, JasmyCoin was up by 10.53% in the past 24 hours, trading at $0.0324. Ranked #53 on CoinMarketCap, JasmyCoin has a live market cap of $1.5B USD, with a circulating supply of 49B JASMY coins and a maximum supply of 50B JASMY coins. This analysis highlights the key technical indicators and market dynamics, offering insights into JasmyCoin’s potential future performance.