
- Dogwifhat ($WIF) forms a bearish flag pattern, signaling a potential drop to $0.51 if support at $0.700 breaks.
- Sellers dominate as $WIF fails to break resistance at $0.772, keeping the bearish trend intact amid continued downward pressure.
- RSI at 23.32 indicates oversold conditions, but without a reversal signal, $WIF remains vulnerable to further declines.
Dogwifhat ($WIF) shows a bearish flag pattern, with a price target of $0.51. The cryptocurrency consolidates within a narrow range. The price action reflects a sharp drop followed by a period of sideways movement. Despite the attempts for a breakout, the resistance level near $0.772 continues to hold strong. Therefore, the market remains uncertain, with the bearish trend still intact.
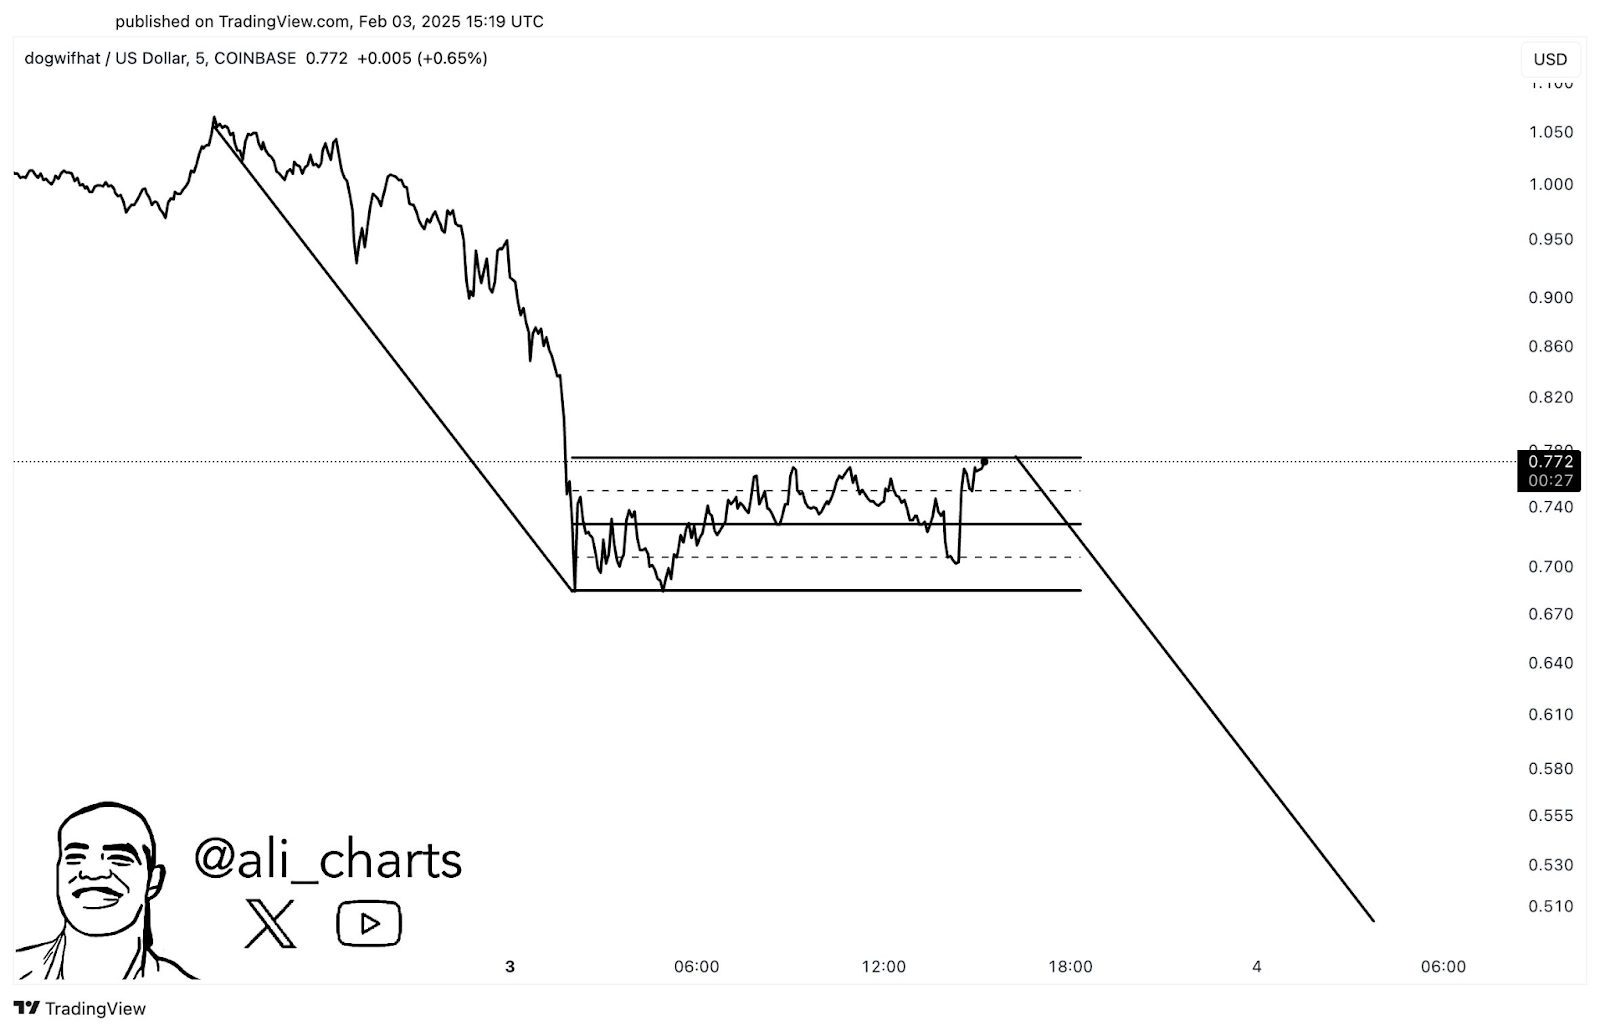
Bearish Continuation Pattern Forms
Between $0.700 and $0.772, the price of $WIF on Coinbase displays a consolidation zone. Within this range, the cryptocurrency varies, testing the levels of support and resistance. Sellers remain in control, preventing any significant upside. Buyers have stepped in at the lower boundary, but their efforts have failed to push the price higher. Hence, the market remains undecided. If the price breaks below the lower support at $0.700, it could trigger further declines.
Moreover, the trendline suggests a possible continuation of the bearish move. A support break could intensify selling pressure, leading the price toward $0.530. The market structure supports a bearish outlook, with a dominant downtrend evident on the chart. Multiple failed breakout attempts reinforce the sentiment that the bears have the upper hand.
Historical Trend Confirms Bearish Sentiment
Looking at longer-term WIF/USDT on Binance, the price has fallen by over 10%. This decline continues the downward trend. The 50-day Exponential Moving Average (EMA) stands far above the current price, confirming bearish pressure.
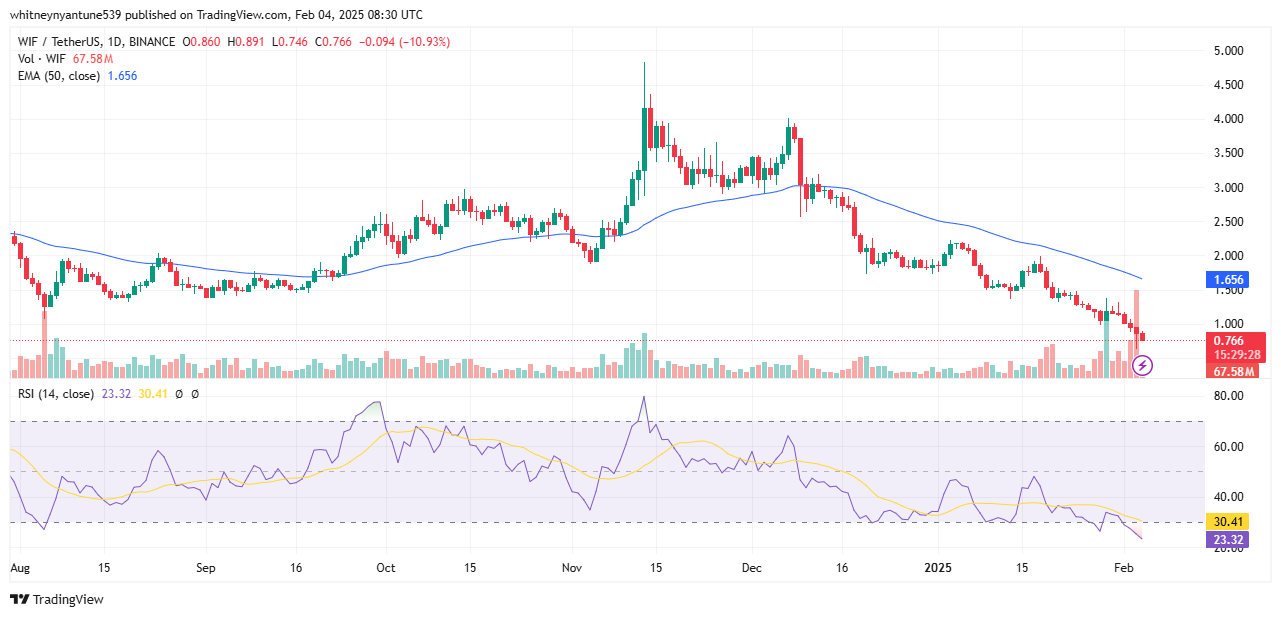
Additionally, the Relative Strength Index (RSI) sits in the oversold zone at 23.32, indicating strong downward momentum. The price has consistently struggled to break above the RSI level of 30.41, further confirming the weakness in the market.
Consequently, with the support level breaking and the RSI signaling oversold conditions, $WIF appears poised for further downside. The lack of a significant reversal pattern only reinforces the bearish trend. Until buyers gain control or a reversal emerges, $WIF’s downward trajectory remains intact.