
- Ethereum’s drop below $2,500 raises concerns, but key support levels may prevent further losses. Traders are watching closely.
- A long-term trendline and Fibonacci levels offer hope, but a break below $2,168 could trigger deeper declines toward $879.95.
- Recovery is possible if Ethereum holds support, but resistance must be broken for a bullish reversal. Market sentiment is key.
With Ethereum’s price falling below $2,500 the market’s increasing volatility is shown by the most recent 13.23% decline. Ethereum saw a drop after testing the $4,100 resistance before being rejected. As a result, investors are now closely watching key support zones.
Ethereum’s Market Structure and Key Levels
Ethereum’s historical price action has shown a pattern of rapid increases followed by deep corrections. The current trend suggests a potential bearish movement, testing the support range between $2,168.45 and $1,994.35. Besides, a strong uptrend emerged in mid-2023, pushing Ethereum higher before hitting resistance.
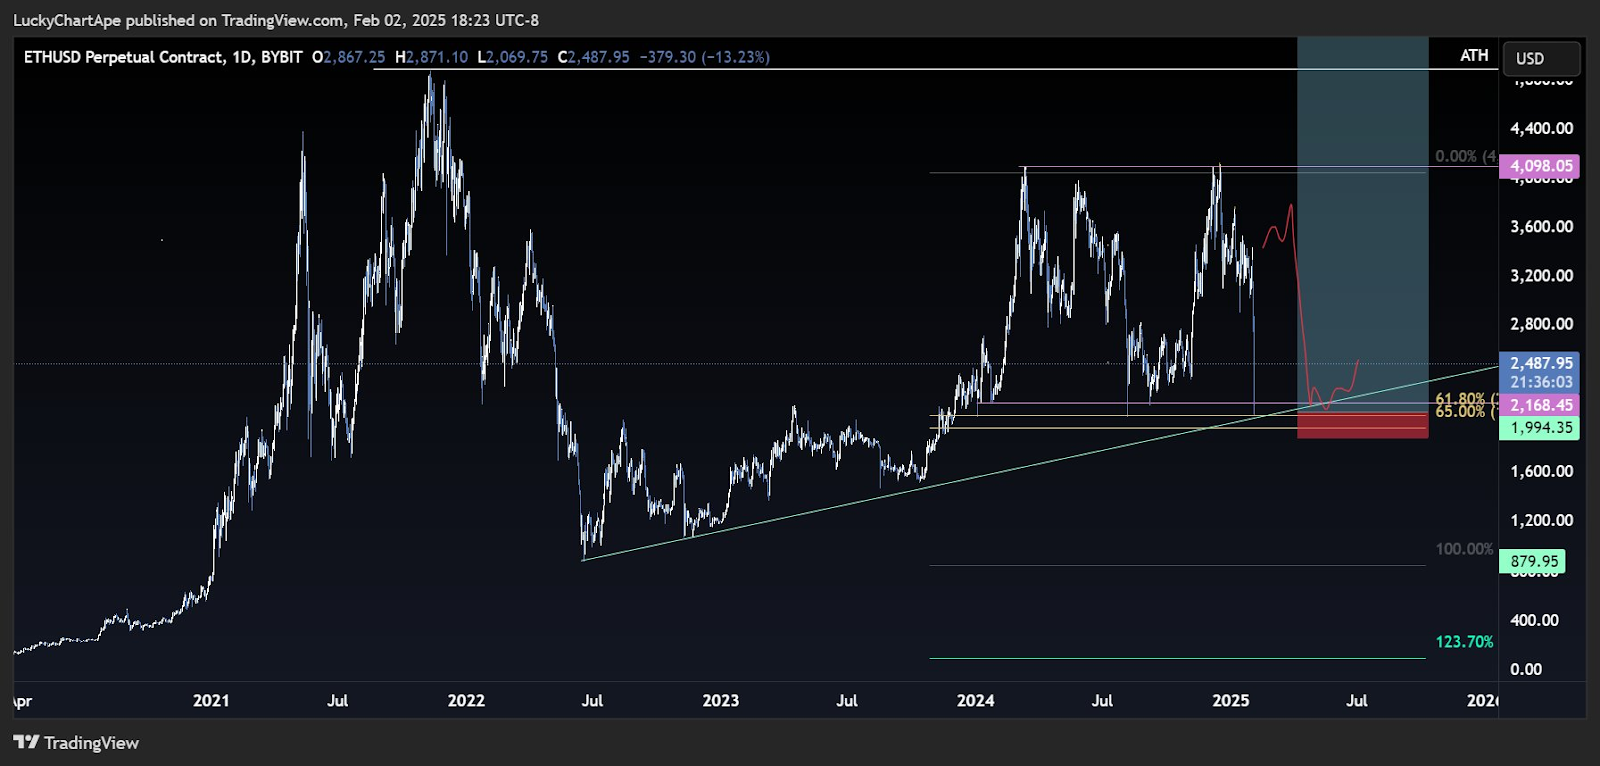
A long-term trendline extends from previous lows, offering dynamic support. Moreover, Fibonacci retracement levels align with these support areas. If Ethereum breaks below this range, a deeper correction could follow. The next level is near $879.95, which aligns with the 123.70% Fibonacci extension in extreme bearish conditions.
Potential Recovery and Market Reactions
Despite the bearish outlook, Ethereum remains within a rising trendline. The market structure has not broken, and the price is still above critical support. Historically, Ethereum has rebounded strongly after reaching support levels. Consequently, investors are considering the potential for recovery.
If Ethereum holds above the current support, it could regain momentum. Additionally, a breakout above resistance would confirm a bullish continuation. However, failing to maintain support could lead to further losses. Market participants must monitor upcoming price reactions to determine Ethereum’s next move.
Moreover, volume and momentum indicators remain crucial in analyzing market sentiment. Although they are not visible, the price action suggests increasing volatility. Traders are responding to short-term fluctuations, while long-term investors assess historical support levels.