
- Bitcoin tests pivotal support at $99,753, balancing bullish Ichimoku signals and bearish momentum divergence.
- Stiff resistance near $110,000 limits upside; a breach below $99,753 could reshape Bitcoin’s medium-term trend.
- The daily chart reveals consolidation around $101,000, with key horizontal support levels at $91,070 and $87,325.
This week’s price movement of Bitcoin indicates a turning point as the top cryptocurrency tests important support levels. Titan of Crypto posted a weekly Ichimoku analysis that shows that Bitcoin’s Tenkan-sen line is remaining stable as support.

A short-term trend indicator called the Tenkan-sen is still above the Kijun-sen, suggesting possible bullish momentum. Bitcoin’s weekly finish above the Tenkan would maintain the current upward structure even though the candle from last week lacked bullish intensity.
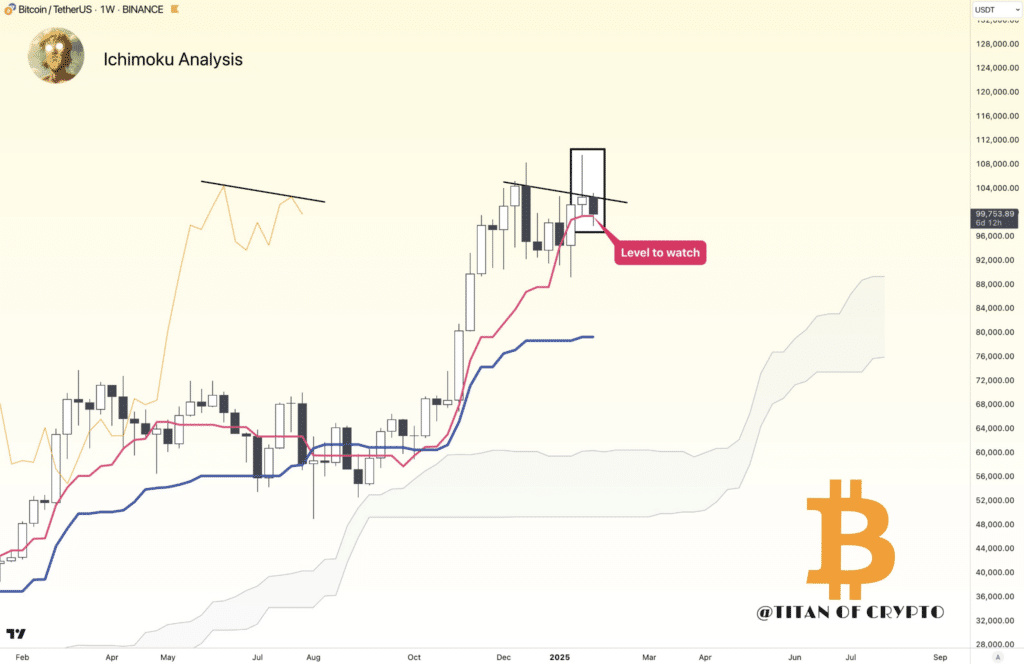
Besides, the Ichimoku Kumo cloud’s upward slope suggests continued bullish potential if prices stay above the $99,753.89 support. However, a bearish divergence in the oscillator warns of weakening momentum. This divergence aligns with higher highs in price but lower highs in the oscillator, highlighting potential downside risks.
Key Resistance Levels Limit Upward Movement
Bitcoin faces stiff resistance near $110,000, with a rejection pushing prices to consolidate around $100,000. The $99,753.89 level serves as a critical support zone. A failure to hold above this level could lead to further declines, with the Kijun-sen at approximately $92,000 acting as secondary support.
Consequently, traders are closely monitoring these levels as any breach could reshape Bitcoin’s medium-term trend. The weekly Ichimoku analysis provides a comprehensive view of these dynamics, helping traders navigate complex market conditions.
Daily Chart Highlights Volatility
Meanwhile, Rekt Capital’s daily chart analysis adds another layer of insight into Bitcoin’s volatility. Bitcoin failed to close above the $106,148.52 resistance, retreating into the $101,000-$106,000 consolidation range. Moreover, the price is trading near $101,165.33, just above the black Range Low support at $101,200.
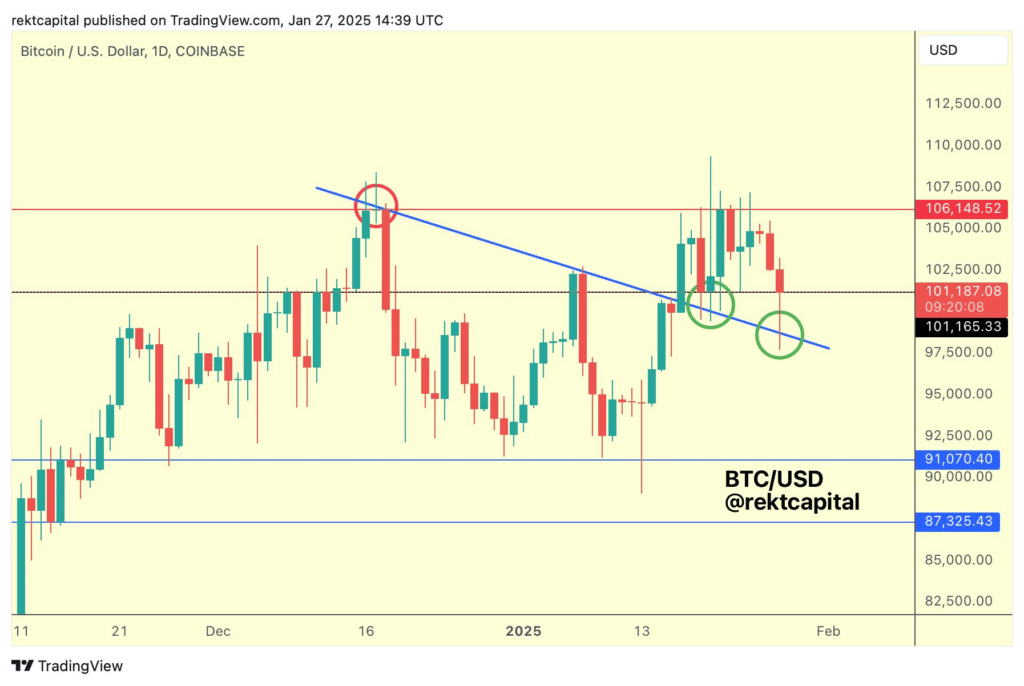
Additionally, the blue diagonal trendline, previously a resistance, now acts as support. A successful retest of this trendline has provided temporary stability. However, the market’s focus remains on maintaining price levels above $101,000 to preserve consolidation. Further downside could target horizontal support at $91,070.40 and $87,325.43.