

- Analyst reports SUI transactions per second rising over 200% in six months, with TVL increasing more than 10%.
- SUI trades near $0.72, with RSI at 46.02 and a bullish MACD crossover suggesting early recovery momentum.
- SUI faces resistance at $0.75 and $0.80, while $0.70 remains critical support against further downside.
SUI is trading near $0.72 despite growing network activity, as analyst Michael van de Poppe highlights rising transactions and total value locked. On November 19, 2026, SUI showed early stabilization after weeks of losses. However, its four-hour technical indicators still reflect a broader bearish trend.
Michael van de Poppe Highlights SUI Network Growth
According to van de Poppe, SUI’s transactions per second (TPS) increased more than 200% in less than six months. Additionally, the network’s total value locked (TVL) rose more than 10% within one month.
Despite these developments, SUI’s market price continued falling alongside other altcoins. Van de Poppe attributed the decline partly to broader market pressure rather than changes within individual protocols. He also highlighted growing interest in AI agents and the agentic economy.
Furthermore, he identified SUI’s ecosystem as an area of particular interest. Van de Poppe said investors face corrections even when underlying protocol fundamentals remain unchanged. He also disclosed that SUI represents his largest investment position.
SUI Price Consolidates After Extended Decline
Meanwhile, SUI traded at $0.7262 on November 19, according to the four-hour Binance chart. Its latest candle opened at $0.7260, reached $0.7299, and touched $0.7216.
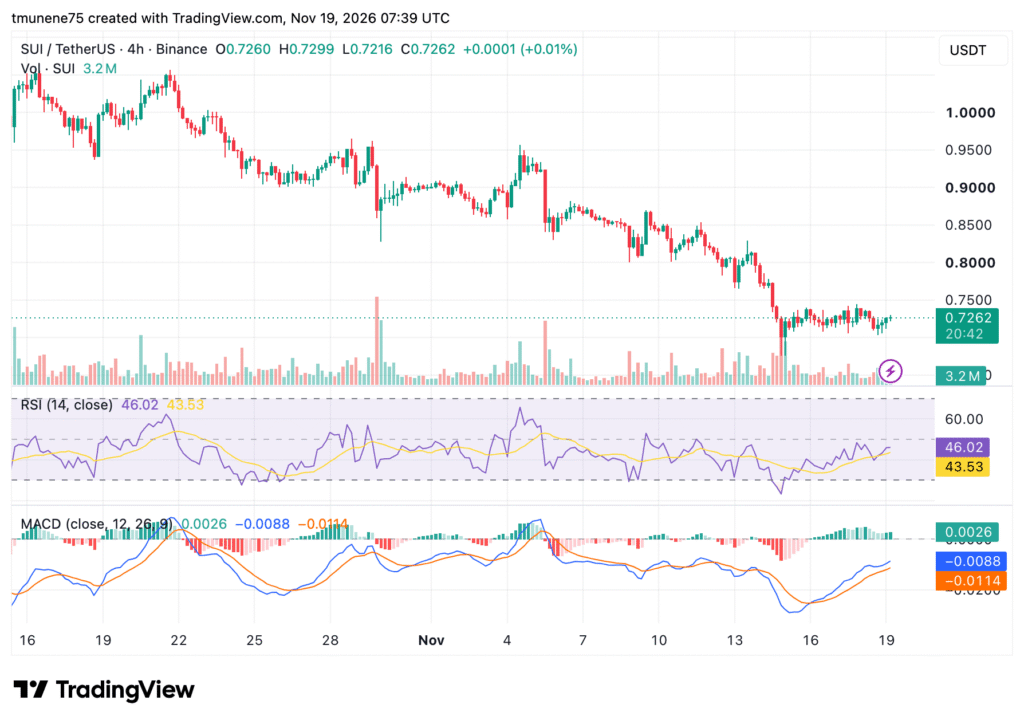
The token recorded a marginal 0.01% gain, while trading volume reached 3.2 million SUI. However, the broader trend remains bearish following its decline from approximately $1.04 in mid-October.
Selling intensified around November 14–15, pushing SUI from approximately $0.80 toward $0.70. Subsequently, the price recovered and consolidated between $0.72 and $0.74.
RSI and MACD Show Early Recovery Signals
SUI’s Relative Strength Index (RSI) currently stands at 46.02, above its moving average of 43.53. However, it remains below 50, indicating that buyers have yet to establish bullish dominance.
The MACD offers a stronger recovery signal, with its line at -0.0088 against the signal line’s -0.0114. Its positive histogram reading of 0.0026 confirms a bullish crossover. Nevertheless, both MACD lines remain below zero. Immediate support is at $0.72, followed by $0.70.
On the upside, resistance is at $0.75, with $0.80 and $0.85 as subsequent levels. A sustained break above $0.75 could strengthen recovery prospects, while a drop below $0.70 would expose SUI to further losses.