

- Bitcoin long-term holder supply has fallen by 300,000 BTC since August, with its 30-day average change reaching minus 195,000 BTC.
- BTC trades near $80,535 as RSI remains below 50 and MACD stays negative, reflecting weak momentum and continued selling pressure.
- Bitcoin faces support at $80,000 and $79,000, while reclaiming $82,000 could open a recovery toward 83,000–84,000.
Bitcoin is approaching $80,000 as long-term holders reduce their holdings, adding selling pressure to an already weakening market. Analyst Darkfost reported that long-term holder supply has fallen by 300,000 BTC since August, while its 30-day average change stands at minus 195,000 BTC. Meanwhile, Bitcoin’s four-hour chart shows repeated resistance rejections and weak momentum.
Long-Term Holder Supply Declines Despite Earlier Growth
Darkfost said approximately 15.6 million BTC currently belong to long-term holders, defined as investors holding coins for more than 155 days. In December 2025, this group held around 14 million BTC, meaning another 1.6 million BTC have since entered the category.
However, long-term holder supply has declined by 300,000 BTC since August as Bitcoin rebounded. Darkfost said these holders generally sell less readily than short-term holders, but recent outflows indicate some have taken profits.
The 30-day average supply change now stands at minus 195,000 BTC. This means long-term holders are selling more Bitcoin than the amount entering their cohort through the 155-day holding threshold.
Bitcoin Price Slides Toward $80,000 Support
Bitcoin traded between $83,000 and $86,000 in late September, briefly approaching $87,000. However, selling intensified around October 6–9, pushing BTC toward $81,000. A recovery toward $84,000 between October 19 and 21 failed to hold.
By October 25, Bitcoin approached $80,000, with a sharp wick briefly extending below $79,000 before prices recovered modestly. The latest four-hour candle showed BTC at $80,535.56, down 0.51%. It opened at $80,805.42, reached $80,900.51 and dropped to $80,404.82.
Technical Indicators Show Weak Momentum
Bitcoin’s Relative Strength Index is at 41.79, above its 40.21 moving average but below the neutral 50 threshold. This indicates weak momentum despite a possible short-term recovery attempt.
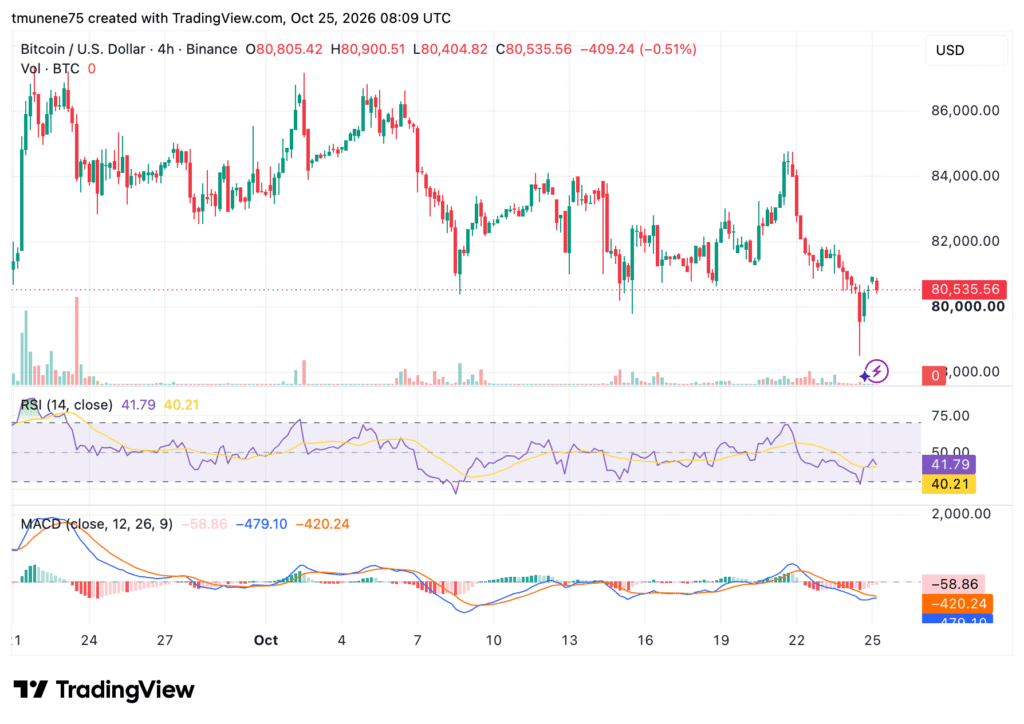
The MACD line remains at minus 479.10, below the signal line at minus 420.24. Its histogram reads minus 58.86, reflecting continued downward momentum.
Immediate support is around $80,000, followed by $79,000. A break below those levels could expose further downside, while reclaiming $82,000 could open a recovery toward 83,000–84,000.