
- Buyers reversed the earlier sell-off to bring XLM back in positive territory from a low near $0.172 on the day.
- There is a falling wedge on the 4-hour chart that indicates a possible price rebound, but need to confirm the pattern breaking a descending resistance.
- The $0.23 target depends on sustained buying, while a break below wedge support could expose XLM to further losses.
XLM is showing signs of recovery after a steep decline, while its falling wedge points toward a possible $0.23 target.
XLM Falling Wedge Draws Attention to $0.23
ALLINCRYPTO (@RealAllinCrypto) describes the four-hour chart as a textbook falling wedge. The analyst sees an opportunity for recovery as market fear persists. The proposed target stands near $0.23, although an upward breakout remains unconfirmed.
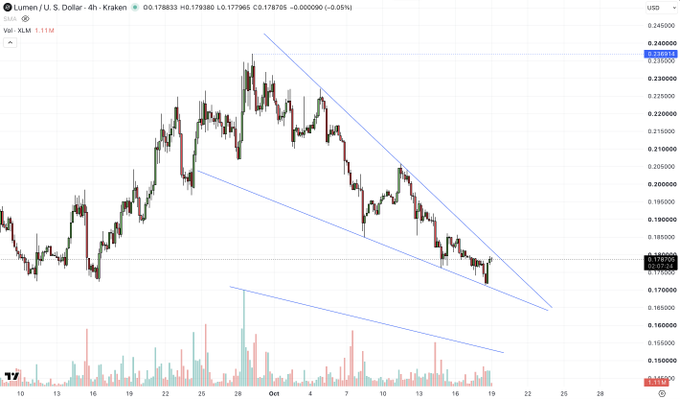
The chart shows XLM rising from below $0.18 during mid-September. The rally reached approximately $0.23 near the end of September before losing momentum. Sellers then pushed prices lower, creating a sequence of declining highs and lows.
Two descending trendlines outline the narrowing price structure throughout October. The upper line is a resistance level, and the bottom line is a series of lows. Their convergence forms the pattern behind the potential recovery scenario.
The token trades near the lower boundary, where buyers could attempt to stop further losses. A sustained rebound would strengthen the bullish case if higher lows begin forming. However, continued weakness could keep prices within the declining structure.
Intraday Recovery Returns XLM to Positive Territory
The 24 hour chart depicts a big sell-off followed by a powerful recovery. XLM was initially trading around 0.177–0.178 before dropping in the morning. Selling continued into the afternoon, bringing the price close to $0.172.
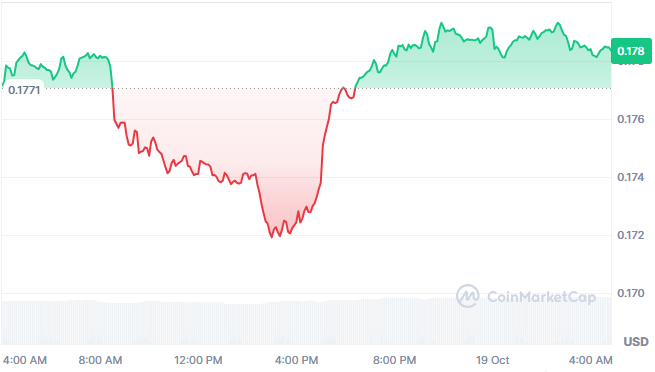
The decline slowed near that low before buyers began pushing prices upward. A stronger advance later carried the token above $0.176. The chart then showed green price action as XLM approached $0.179.
Market data places the token at $0.1784, up approximately 0.2% over 24 hours. This daily gain follows a substantial intraday decline and subsequent recovery. The data indicates a market capitalization of approximately $6.28 billion.
The amount of trading rose by 8.52% in the past 24 hours. This increase mirrored the price action, including a quick fall and recovery. However, volume alone cannot establish whether buyers will maintain control.
Resistance and Support Will Determine the Next Move
The 0.178-0.179 range is immediate resistance after the intraday rebound. Strong action above recent highs may fuel another recovery push. However, repeated rejections here may result in trading sideways or further declines.
A descending upper trendline continues to be a major hurdle on the 4-hour chart. Purchasers will have to breach it and grasp the territory that it has recovered. A brief move through resistance would provide limited confirmation without follow-through.
The analyst’s $0.23 target sits near the earlier trading range’s upper boundary. The chart also marks resistance around $0.236, above that proposed target. Reaching either level would require a substantial recovery from current trading levels.
Support around $0.176 could become relevant if selling pressure returns. Below that area, the intraday low near $0.172 provides another reference point. Failure to break below the wedge’s bottom boundary would make the bull market pattern weaker.
Immediate direction is determined by whether the buyers support and challenge the resistance that is descending. If the price could make it through the breakout level in an upward swing, it would confirm the recovery move. The forecast, that it will move to $0.23, is still pending and there is downside risk.