

- Bitcoin’s $81,000 support could determine whether BTC advances toward $84,000 and $86,500 or retreats to $76,000.
- Ethereum needs to hold $2,350 to target $2,700 and $3,000, while a breakdown could expose support near $2,000.
- XRP must defend $1.25 and break above $1.56 to target $2, while Bitcoin outperforms ETH and XRP on Binance.
Bitcoin is holding above $81,000 as analyst Ali Charts identifies support levels that could determine whether BTC, Ethereum, and XRP rebound or fall further. His analysis sets upside targets at $84,000 for Bitcoin, $2,700 for Ethereum, and $2 for XRP, while a four-hour Binance chart shows BTC outperforming both altcoins.
Bitcoin Tests $81,000 as Ethereum Faces $2,350
Ali Charts identifies $81,000 as Bitcoin’s key support, marking the lower boundary of its daily rising channel. If buyers defend that level, BTC could advance toward $84,000, the channel’s midpoint, and then $86,500. However, a break below $81,000 would put $76,000 in focus.
Ethereum faces a similar test at $2,350, the support line of a right-angled ascending broadening pattern. According to Ali Charts, a rebound could push ETH toward $2,700 or $3,000. However, a daily close below $2,350 would shift attention to $2,000.
XRP Needs $1.25 Support and a $1.56 Breakout
XRP’s key level is $1.25, which Ali Charts says could complete the right shoulder of a potential inverse head-and-shoulders pattern on the three-day chart. However, the formation still needs confirmation. A sustained close above $1.56 could open a path toward $2, while losing $1.25 would put $1 in focus.
Ali Charts said he is monitoring how all three cryptocurrencies react at their respective support levels before calling a reversal. The price levels remain central to his assessment of their next moves.
Bitcoin Outperforms Ethereum and XRP on Binance
The four-hour BTC/USD chart shows Bitcoin trading at $82,641.44, up $236.35, or 0.29%, on the latest candle. Its reported high was $82,719.38, while the low reached $82,405.09. Bitcoin’s relative performance climbed above 8% and briefly approached 10% during the September 18–22 rally.
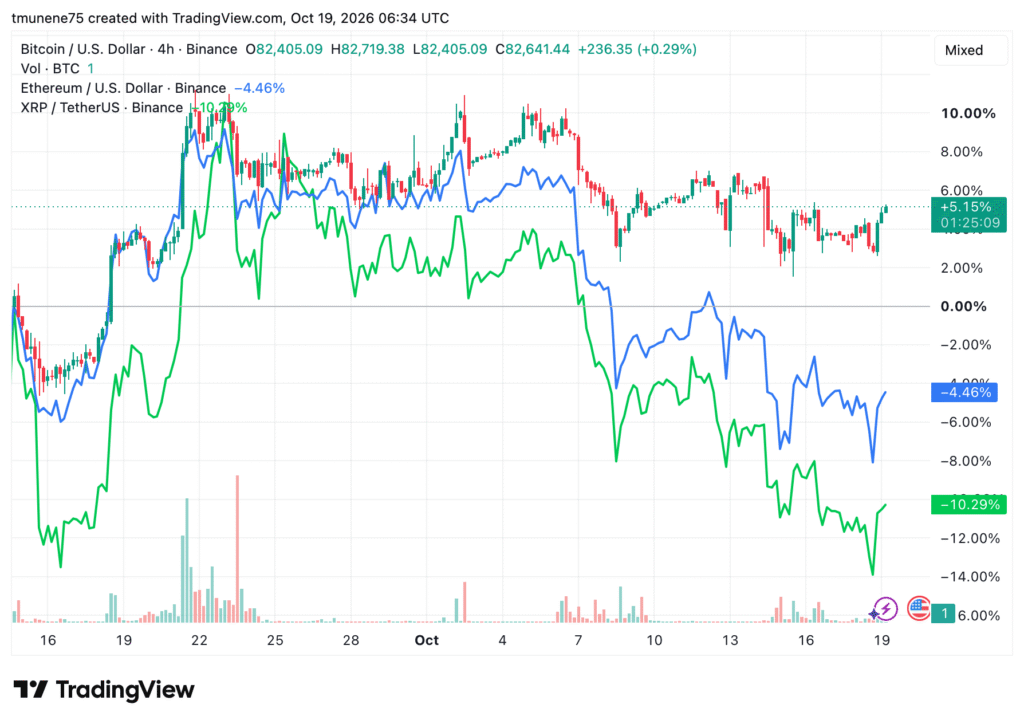
Momentum weakened in early October, followed by a sharp decline around October 7. After further fluctuations, the reading recovered to 5.15%. Ethereum’s comparative performance stood at -4.46%, while XRP recorded -10.29%. Both remained below zero on the chart’s comparison scale.
Trading volume spiked around September 19–23, with smaller bursts during October’s declines. Recent volume remained subdued as Bitcoin attempted to recover.