
- Dogecoin price is testing $0.098, where roughly 28 billion DOGE previously changed hands across the highlighted cost-basis zone.
- The next resistance appears near $0.11, supported by approximately 4.98 billion DOGE from historical trading activity.
- The $0.20 level remains another major hurdle, with about 12 billion DOGE concentrated around that historical price zone.
Dogecoin price is approaching a major resistance level as historical trading activity creates several supply zones above the current market.
$0.098 Emerges as the Immediate Barrier
Ali Charts recently identified $0.098 as a major DOGE resistance zone. The post cites roughly 28 billion DOGE changing hands around that level. That concentration makes the area central to the current market structure.
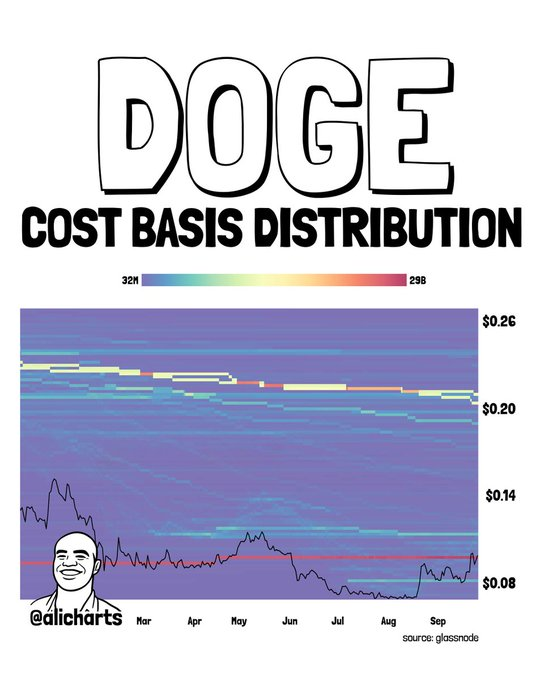
The chart shows price repeatedly moving around the $0.098 region. DOGE reached approximately $0.0985 during the early session advance. It then reversed sharply before recovering toward the same resistance area.
The decline pushed DOGE toward roughly $0.0955 during the session. Buyers subsequently returned, lifting the price back toward $0.098. That recovery placed the market directly against the highlighted cost-basis barrier.
DOGE as of writing trades at around $0.09807. The asset was up approximately 0.5% over 24 hours. CoinGecko also recorded a September 25 close near $0.098946.
Historical Activity Creates Additional Supply Zones
The cost-basis heatmap shows several concentrations above current trading levels.The strongest visible cluster sits around $0.098 on the displayed distribution. Historical transactions create these zones through accumulated trading activity.
However, the distribution does not guarantee selling at those levels. Some holders may retain positions after prices return to their entry areas. Others could adjust their positions based on changing market conditions.
The next zone identified in the analysis sits near $0.11. Approximately 4.98 billion DOGE previously changed hands around that level. That concentration remains smaller than the $0.098 cluster shown earlier.
A move toward $0.11 would therefore introduce another supply area. The distance between $0.098 and $0.11 remains relatively narrow. Price would need to navigate both zones during any continued advance.
$0.20 Remains a Larger Historical Hurdle
The broader chart places another major concentration around the $0.20 level. Ali Charts attributes approximately 12 billion DOGE to that region. That makes $0.20 another important historical cost-basis reference.
The chart also shows DOGE previously trading around higher levels. Price later declined toward approximately $0.08 before entering consolidation. That base formed during the July and August period shown.
September brought renewed movement toward the $0.09 region. The latest recovery has now returned DOGE toward $0.098. The market therefore sits directly against its first major resistance.
Market data as of writing shows substantial activity surrounding the asset. CoinGecko lists DOGE near $0.09842, with $831 million in volume. Its reported seven-day gain stands around 10.8% at the latest update.
The chart consequently presents three major levels for continued monitoring. The first sits at $0.098, backed by roughly 28 billion DOGE. The next stands near $0.11, followed by the $0.20 concentration.