
- HYPE reached $95.68 after recovering from the $77-$80 area, with $96-$100 now acting as key resistance.
- Crypto Patel identifies $95 as the inverse head-and-shoulders neckline, with a daily close above it potentially targeting $150.
- RSI sits at 77.97 while MACD weakens, keeping $90, $85 and $78-$80 as nearby support if HYPE pulls back.
Hyperliquid’s HYPE reached $95.681 on Sept. 21, while analyst Crypto Patel warned about an inverse head and shoulders pattern. Patel focused on the $95 neckline, saying a strong daily close above it could target $150. However, rejection could expose HYPE to a move toward the $50-$53 support zone.
HYPE Pushes Toward $100 After Sharp Recovery
The latest four-hour KuCoin candle opened at $94.208 and reached $96.017 before settling at $95.681. The move added $1.474, or 1.56%, during the latest session. HYPE traded near $59-$60 in late August before climbing above $70.
It then consolidated between roughly $78 and $85 before another advance. In early September, HYPE reached about $88-$89 before correcting toward $77-$80 between Sept. 12 and 16. The price later reversed and moved above $85 and $90.
That recovery brought HYPE close to $96, with resistance now sitting around $96-$100. Meanwhile, support has emerged around $90, followed by $85 and $78-$80.
Crypto Patel Watches the $95 Neckline
According to Crypto Patel, HYPE is forming an inverse head and shoulders structure near a major top. He noted that such patterns usually develop near market bottoms. Patel said a similar setup near a major top can create a liquidity trap after a breakout.
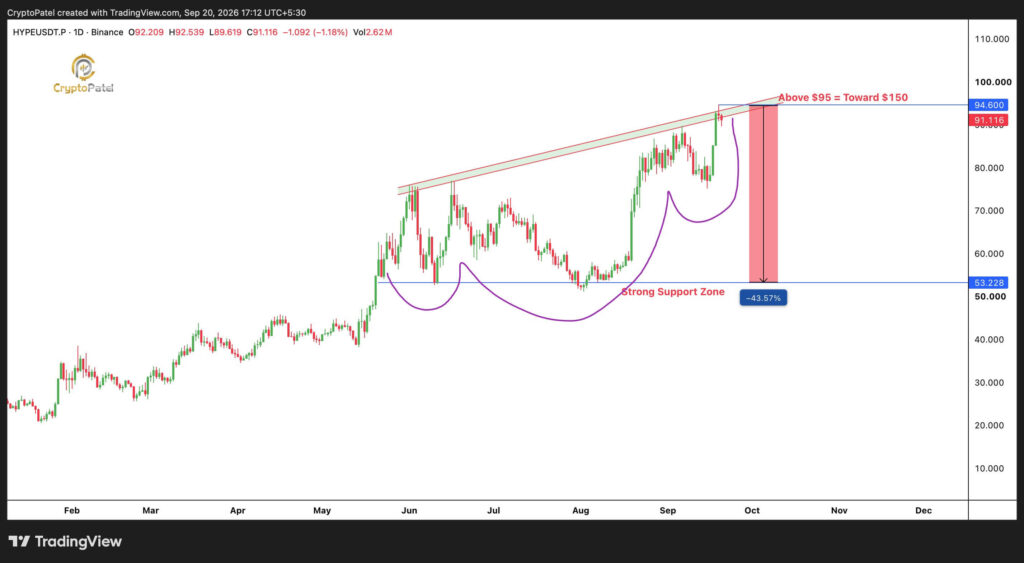
He identified $95 as the key neckline resistance. A strong daily close above $95 could open a path toward $150, according to Patel. However, rejection below $95 would raise the risk of a failed breakout.
Patel also identified about $53 as strong support. If that level fails, he said HYPE could face a deeper reset.
RSI And MACD Show Mixed Momentum
HYPE’s RSI is at 77.97, above its moving average at 73.91. The reading places the token in overbought territory and raises the possibility of profit-taking or consolidation. Meanwhile, the MACD line is near 2.679, below the 2.761 signal line.
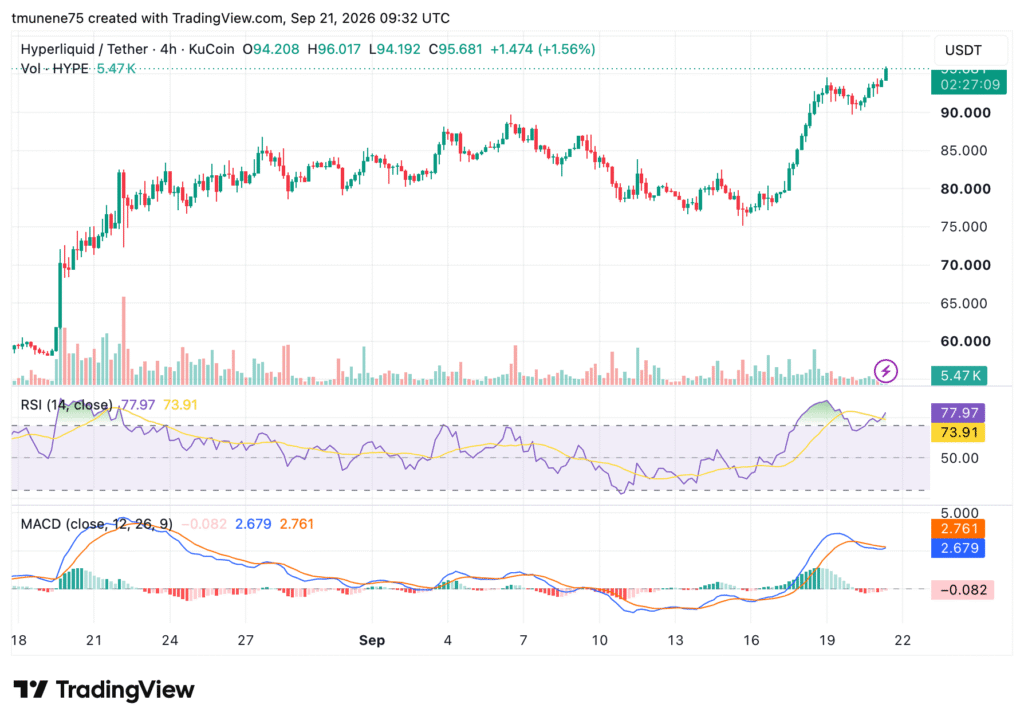
The histogram reads -0.082, showing weaker momentum despite the recent price advance. Patel said he was not calling for a short position. Instead, he said he would watch $95 and the $50-$53 zone closely.
The chart shows $100 as the next major psychological level if buying pressure continues. A rejection could instead bring HYPE back toward nearby support.