
- Stellar stablecoin supply grew by 2.4% in a week to approach $960M, with TVL still holding elevated levels after hitting a record $265M in August.
- XLM reversed from $0.172-$0.185, while $0.180 currently serves as a key level in the current consolidation within the chart.
- MACD has turned mildly negative, while RSI near 52 keeps momentum balanced as XLM tests resistance around $0.185 near current levels.
XLM enters a stronger technical setting as network liquidity expands, while price momentum, stablecoin growth, and total value locked provide measurable signals for market participants across the current market structure.
Stellar Stablecoin Growth Expands Network Liquidity
Stellarmintio recently pointed to stronger fundamentals across Stellar’s network. The post cited stablecoin supply nearing $960 million after weekly growth. That increase placed Stellar around the 14th-largest stablecoin chain by supply.
The reported stablecoin balance rose 2.4% during the measured week. Such growth indicates expanding stable-value liquidity across the network. For Stellar, that liquidity aligns closely with its payment-oriented blockchain structure.
The same post also referenced Stellar’s total value locked. TVL reached an all-time high of $265 million on August 22. It later stood near $233 million, according to the supplied figures.
The year-long TVL trend remained broadly higher despite that recent decline. Stablecoin supply and TVL measure different forms of network capital. Together, they provide separate indicators of liquidity and deployed ecosystem value.
Price Recovery Brings $0.185 Resistance Into Focus
The latest chart shows XLM recovering sharply from early-session weakness. Price initially fell toward the $0.172 area before reversing higher. The rebound then carried the token through $0.177 and $0.180.
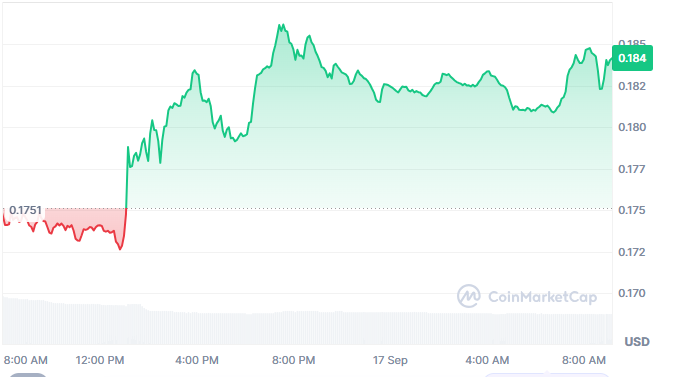
The recovery accelerated as buyers pushed toward approximately $0.185. A pullback followed, bringing price back toward the $0.180 region. XLM as of writing trades at $0.1834, a rise by 5.1% over the last 24 hours.
The $0.180 level now provides a nearby reference beneath current trading. Meanwhile, $0.185 represents the immediate resistance visible on the chart. A sustained move beyond that area would alter the current short-term structure.
Market data shows capitalization near $6.39 billion. Fully diluted valuation stands near $9.17 billion, based on supplied figures. Circulating supply is approximately 34.84 billion XLM, against 50 billion total.
MACD and RSI Show Cooling Momentum
The momentum remains mixed after the latest upward price move. MACD currently shows its blue line below the orange signal line. The histogram is also negative, reading approximately -0.00028701.
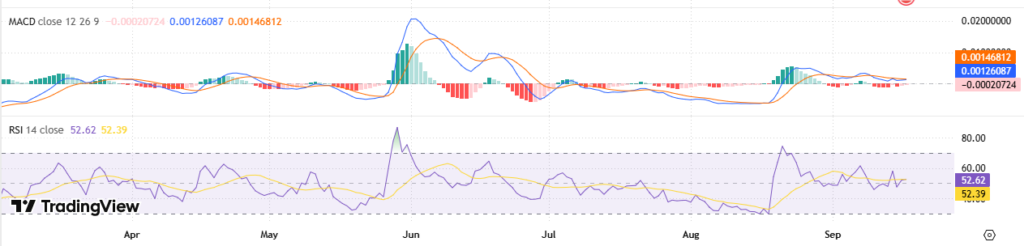
That structure indicates mild downside momentum after August’s stronger recovery. Earlier, MACD produced larger positive bars during major upward movements. Momentum subsequently faded as the indicator returned toward the zero area.
RSI as of writing, stands near 51.82, while its average sits around 52.33. Both readings are very close to the 50 mid-point. Hence, the indicator doesn’t reveal overbought or oversold condition.
Volume provides another consideration for the latest price movement. The reported 24-hour volume is down approximately 31.85%. As a result, the recovery occurred alongside lower reported trading activity.
The combined indicators leave XLM between improving price structure and softer momentum. Holding above $0.180 would keep the recent recovery range intact. A break below that area could redirect attention toward lower support zones.